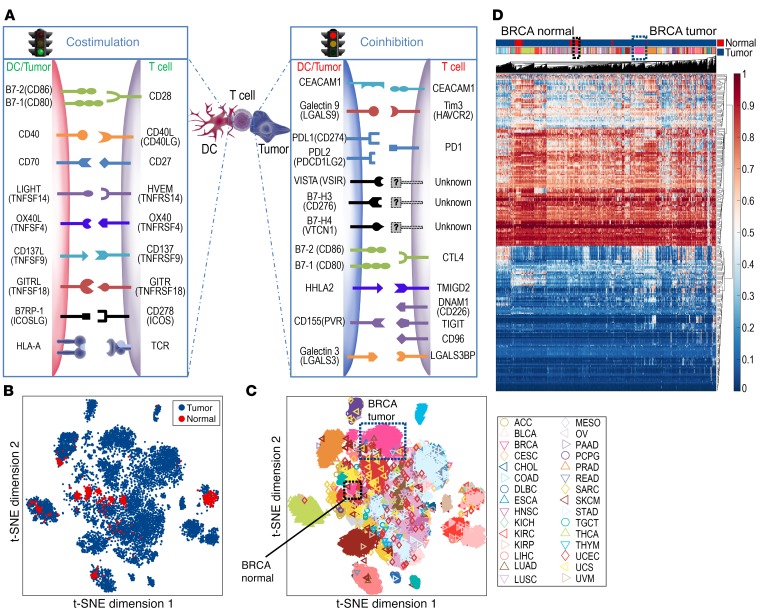
Figure 1. The distinct pattern of immune synapse gene methylation depends on tumor histology.
(A) Schematic of an immune synapse between the antigen-presenting cells/tumor and T cells. (B) t-SNE analysis was performed on 8,186 solid tumors and 745 normal adjacent tissues based on the β values for methylation levels for all probes for CSGs and ICGs from A, contrasting tumor (blue) versus normal adjacent tissue (red). (C) The spatial relationship between distinct tumor types is depicted, with breast tumors in the blue-dotted box and normal adjacent tissue samples in the black-dotted box. (D) Unbiased hierarchical clustering analysis is shown. ACC, adrenocortical carcinoma; BLCA, bladder urothelial carcinoma; BRCA, breast invasive carcinoma; CESC, cervical squamous cell carcinoma and endocervical adenocarcinoma; CHOL, cholangiocarcinoma; COAD, colon adenocarcinoma; DLBC, lymphoid neoplasm diffuse large B cell lymphoma; ESCA, esophageal carcinoma; HNSC, head and neck squamous cell carcinoma; KICH, kidney chromophobe; KIRC, kidney renal clear cell carcinoma; KIRP, kidney renal papillary cell carcinoma; LIHC, liver hepatocellular carcinoma; LUAD, lung adenocarcinoma; LUSC, lung squamous cell carcinoma; MESO, mesothelioma; OV, ovarian serous cystadenocarcinoma; PAAD, pancreatic adenocarcinoma; PCPG, pheochromocytoma and paraganglioma; PRAD, prostate adenocarcinoma; READ, rectum adenocarcinoma; SARC, sarcoma; SKCM, skin cutaneous melanoma; STAD, stomach adenocarcinoma; TGCT, testicular germ cell tumors; THCA, thyroid carcinoma; THYM, thymoma; UCEC, uterine corpus endometrial carcinoma; UCS, uterine carcinosarcoma; UVM, uveal melanoma.

