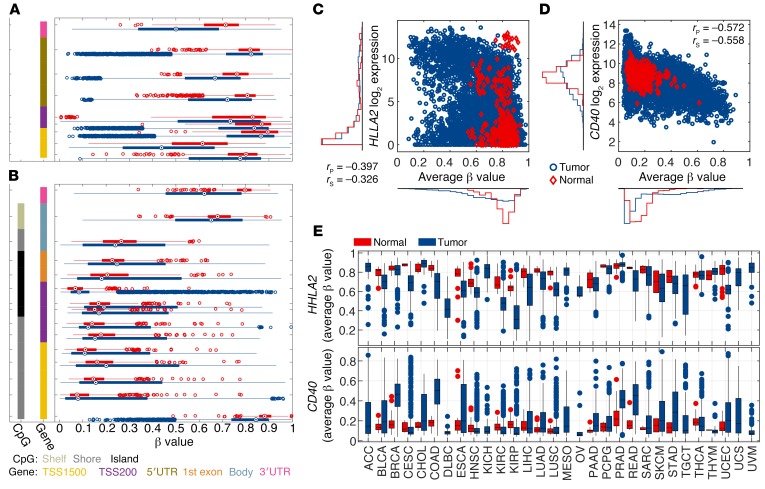
Figure 2. The polarity of methylation patterns for costimulatory and immune checkpoint ligands.
(A and B) β Values of methylation probes for TSS1500, TSS200, 5′UTR, body, and 3′UTR of the HHLA2 gene (A), an example of an ICG, or CD40 (B), an example of a CSG, derived from all tumor samples (blue) and normal adjacent tissues (red) are depicted. The methylation level for each probe is represented by a box plot. The left-most column indicates the presence of CpG islands, while the second-column colors indicate where on the gene the probe is located. The average β values for selected probes within TSS1500, TSS200, and 5′UTR are plotted against gene expression for HHLA2 (C) or CD40 (D). Each marker represents an individual tissue sample. (E) A box plot of average β values for selected probes for HHLA2 and CD40 from tumor (blue) and normal adjacent tissue (red) is shown. rP and rS are Pearson’s and Spearman’s correlation coefficients, respectively.

