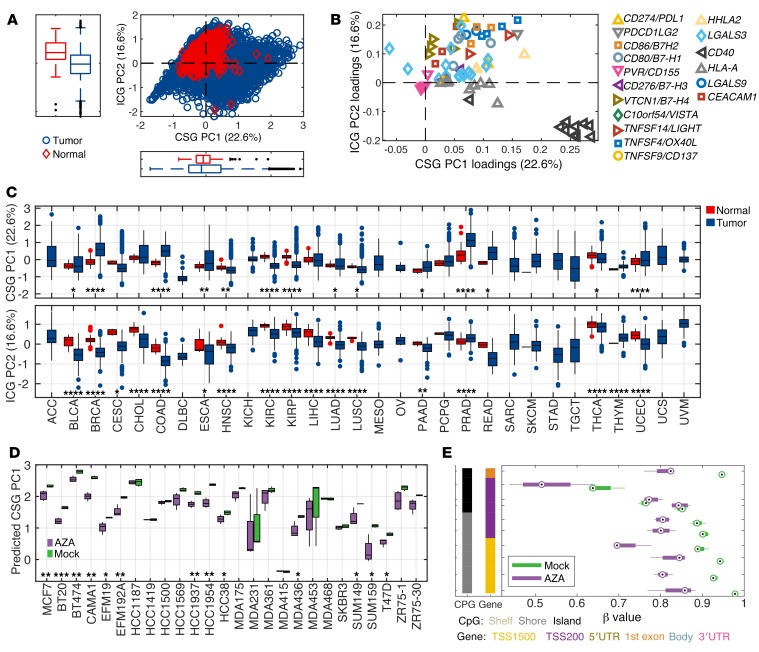
Figure 3. Principal component analysis (PCA) segregates costimulatory and immune checkpoint ligands.
(A) Two-dimensional plot of PC1 and PC2 scores for all tumor types (blue) and normal adjacent tissues (red) is shown. (B) The importance of the variables (CpG probes) for PC1 and PC2 is depicted. (C) A box plot of PC1 and PC2 scores for tumor (blue) and normal adjacent tissue (red) compared across histologic types. (D) PC1 scores of mock- or 5-azacitidine–treated epithelial cancer cell lines. (E) The methylation status of the CD40 gene in mock- or 5-azacytidine–treated CAMA1 cell line. *P < 0.05, **P < 0.01, ***P < 0.001, ****P < 0.0001 by 2-sided Student’s t test.

