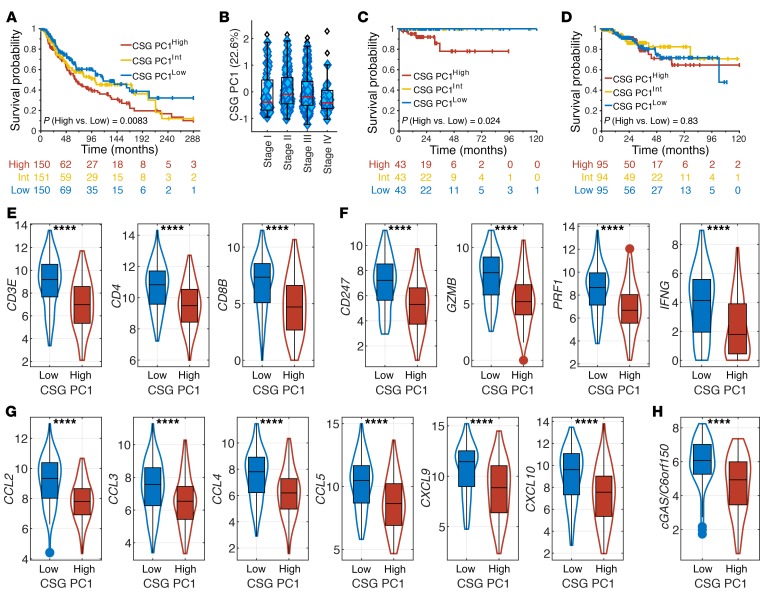
Figure 4. The methylation status of costimulatory ligands is prognostic in melanoma.
(A) Kaplan-Meier curves for DSS of melanoma patients with high, intermediate, and low tertiles of PC1 scores are shown. Higher PC1 scores represent hypermethylation of CSGs. (B) Box plot of PC1 score distribution based on melanoma patient staging. (C and D) Kaplan-Meier curves for DSS of UCEC patients with MSI (C) or without MSI (D) with high, intermediate, and low tertiles of PC1 scores are shown. (E) T cell recruitment in PC1High and PC1Low melanoma patients is approximated by gene expression of CD3E, CD4, and CD8B. (F) T effector functions in PC1High and PC1Low melanoma patients are approximated by gene expression of CD3ζ (CD247), granzyme B (GZMB), perforin (PRF1), and IFN-γ (IFNG). (G) Chemokines for immune cell trafficking in PC1High and PC1Low melanoma patients is approximated by gene expression of CCL2, CCL3, CCL4, CCL5, CCL9, and CCL10. (H) Immunogenicity of PC1High and PC1Low melanoma patients is approximated by gene expression of cGAS. P values in A, C, and D were derived from a log-rank test comparing PC1High and PC1Low groups. ****P < 0.0001 by 2-sided Student’s t test.

