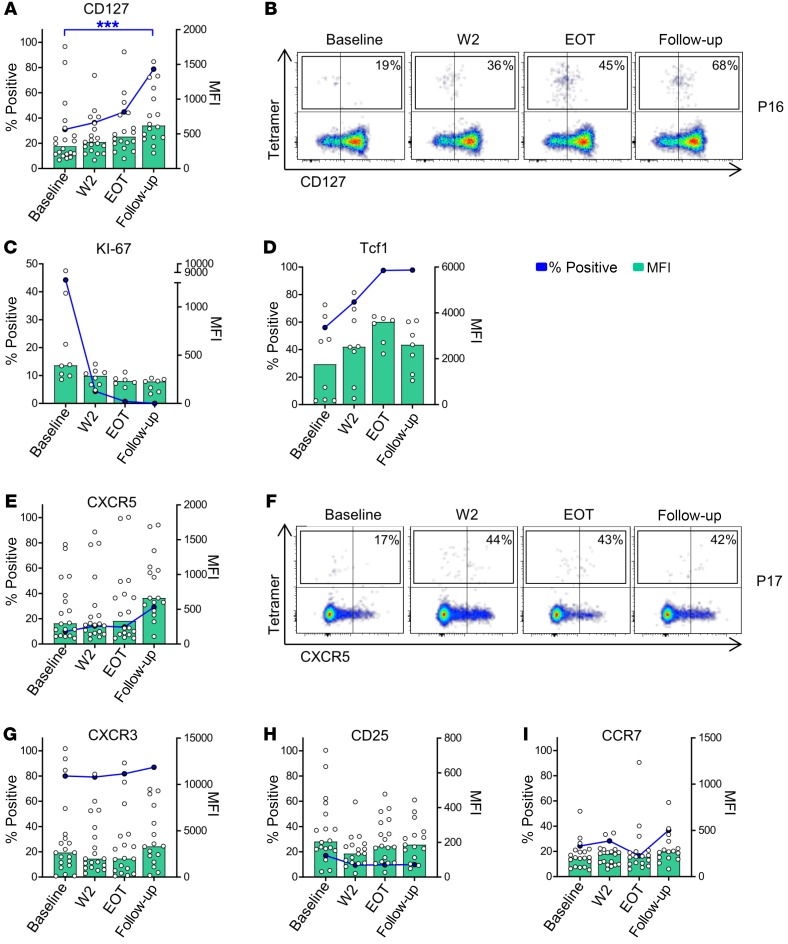
Figure 4. Cytokine receptor, chemokine receptor, and transcription factor expression on HCV-specific CD4+ T cells.
(A, C–E, and G–I) Median expression of the individual surface marker on HCV-specific CD4+ T cells is characterized by the blue dots and lines. The MFI of the individual samples and the median MFI are displayed as white scattered dots and green bars, respectively (n = 20 for CD127, CXCR3, CCR7, CXCR5, and CD25; n = 8 for Ki-67 and Tcf1). Each symbol represents 1 patient, bars represent medians. (B and F) Representative pseudocolor plots for expression of CD127 and CXCR5 are shown after gating on live, non-naive CD4+ T cells from 2 patients (P16 and P17). *P < 0.05, ***P < 0.001; nonparametric distribution with Wilcoxon’s matched-pairs signed-rank test between indicated groups. Due to multiple comparisons (n = 3), significance level was adjusted using Bonferroni’s correction and P values of < 0.01 were considered statistically significant. Thus, P values > 0.01 are not indicated.

