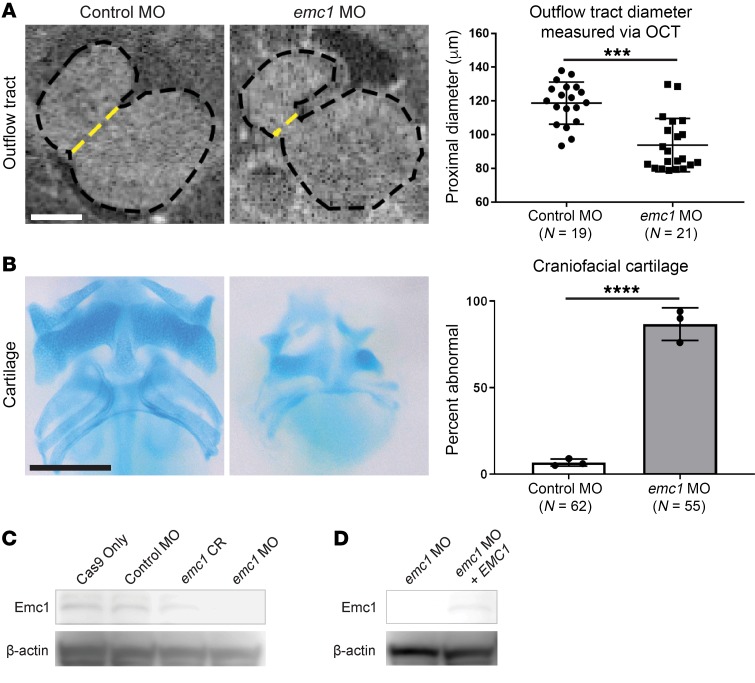
Figure 1. Phenotypic assessment of Emc1 loss of function in Xenopus reveals craniofacial and cardiac dysmorphology.
1-cell–stage embryos were injected with either standard control MO or emc1 MO and phenotypically assessed at stage 45. (A) Representative images and measurements of 3 replicates of stage 45 control MO (n = 19) and emc1 MO (n = 21) embryo outflow tract morphology imaged with OCT imaging (dotted yellow line indicates measured diameter). Scale bar: 100 μm. (B) Representative images and percentages of 3 replicates of stage 45 control MO (n = 62) and emc1 MO (n = 55) embryo craniofacial cartilage stained with Alcian blue. Scale bar: 250 μm. (C) Immunoblot of pooled (n = 20) Emc1 protein in control and emc1 knockout/knockdown embryos. (D) Immunoblot of pooled (n = 20) Emc1 protein in emc1 knockdown and EMC1 rescued emc1 knockdown embryos. ****P < 0.0001, ***P < 0.0005 by (A) Student’s t test or (B) Fisher’s exact test. Bars indicate mean and SD.

