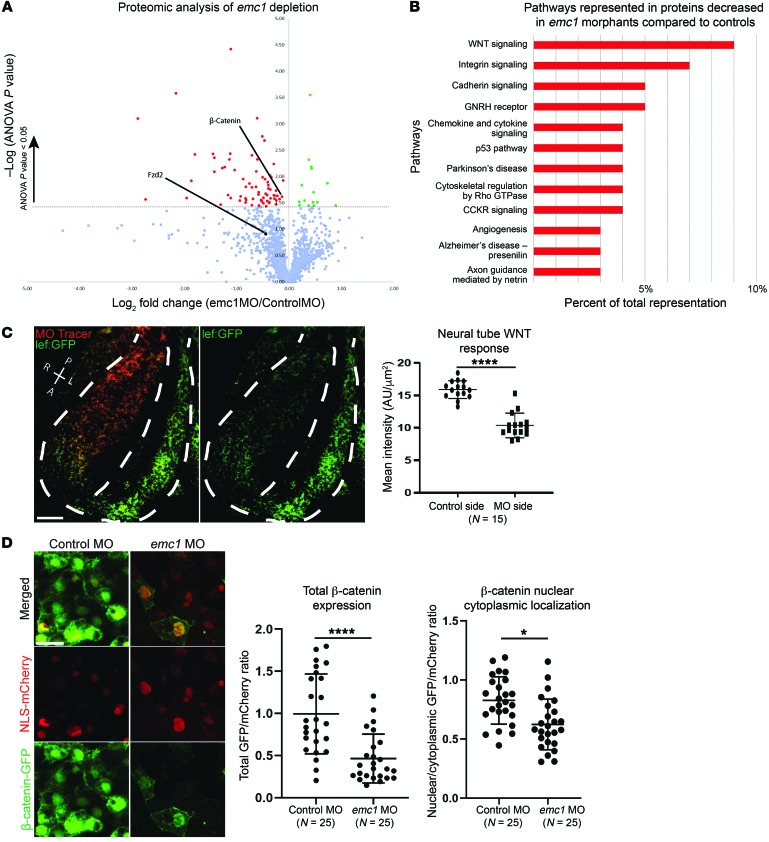
Figure 3. Proteomic analysis of emc1 knockdown uncovers affected developmental pathways including WNT signaling.
One-cell–stage embryos were injected with either standard control MO or emc1 MO, and LFQMS was carried out on stage 24 embryos. (A) Plot of mean protein levels from 3 biological replicates of 20 pooled emc1 morphants compared with control morphants as determined via LFQMS (statistically significantly increased proteins are shown in green, statistically significantly decreased proteins are shown in red, Fzd2 is shown as a black dot since it was only identified by one unique peptide sequence as opposed to the other proteins in the graph). (B) Plot of gene ontology terms for statistically significantly decreased proteins with human homologs displays enrichment for a subset of signaling pathways. (C) Representative image and quantitation of WNT signaling visualized in a transgenic Xenopus WNT reporter line as a comparison between mean fluorescence of emc1 MO-injected versus uninjected sides of the neural tube (white dotted line shows outline of neural tube and division between injected and uninjected sides). P, posterior; A, anterior; R, right; L, left. Scale bar: 100 μm. (D) Representative image and quantitation of β-catenin subcellular localization visualized in Xenopus neural tubes as a comparison between emc1 MO-injected versus control MO-injected embryos normalized to NLS-mCherry localization. Statistically significant protein changes assessed via ANOVA (A) with red and green points indicating P < 0.05. Scale bar: 10 μm. ****P < 0.0001, *P < 0.05 by Student’s paired t test (C) and Student’s t test (D). Bars indicate mean and SD.

