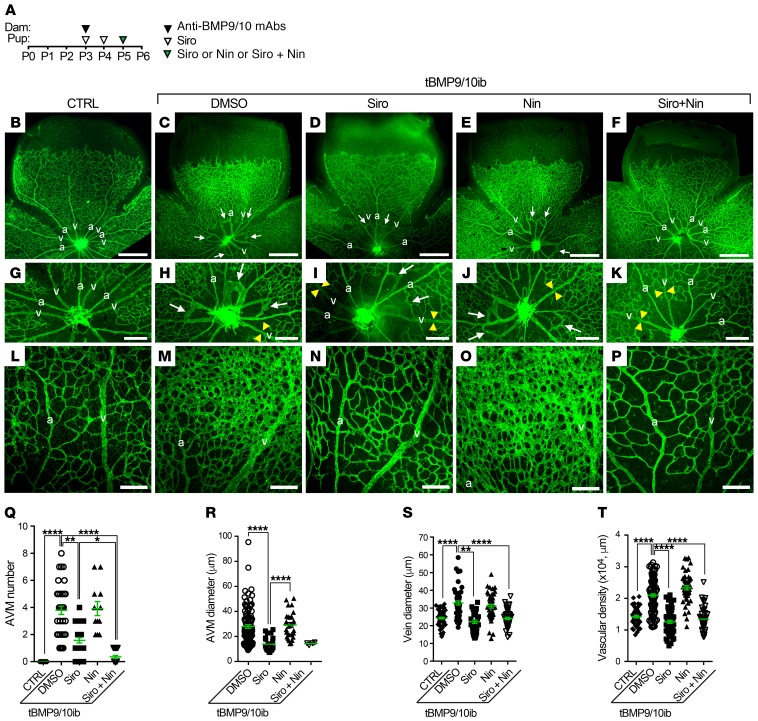
Figure 1. Siro + Nin prevents vein dilation, hypervascularization, and AVMs in the tBMP9/10ib mouse retina.
(A) Schematic representation of the protocol of disease induction (i.p. injections of the lactating dams with anti-BMP9/10 antibodies, anti-BMP9/10 mAbs) and of drug treatments (i.p. injections of the pups with Siro and/or Nin). Arrowheads indicate the postnatal days of injection. Control (CTRL) mouse pups were obtained by injecting the lactating dams with isotype controls and by directly injecting them with DMSO. Pups were euthanized at P6. (B–P) Representative images of retinas stained with fluorescent isolectin B4 (green) from CTRL (B, G, and L) mice and tBMP9/10ib mice treated with vehicle (DMSO; C, H, and M), Siro (D, I, and N), Nin (E, J, and O), or the combination of Siro and Nin (F, K, and P). Higher magnification in G–K and L–P shows respectively retinal vein diameter (yellow arrowheads) and retinal vascular fields (plexus area) between an artery (a) and a vein (v). Arrows denote AVMs. Scale bars: 500 μm (B–F), 200 μm (G–K), and 100 μm (L–P). (Q–T) Scatter plots measuring AVM number (Q), AVM diameter (R), vein diameter (S), and vascular plexus density (T) in CTRL and tBMP9/10ib mice treated as in B–F. Data represent individual retinas and mean ± SEM (n = 14, 38, 28, 12, and 20 retinas for the CTRL, DMSO, Siro, Nin, and Siro + Nin groups, respectively); Kruskal-Wallis test, post hoc Dunn’s multiple-comparisons test. *P < 0.05; **P < 0.01; ****P < 0.0001.

