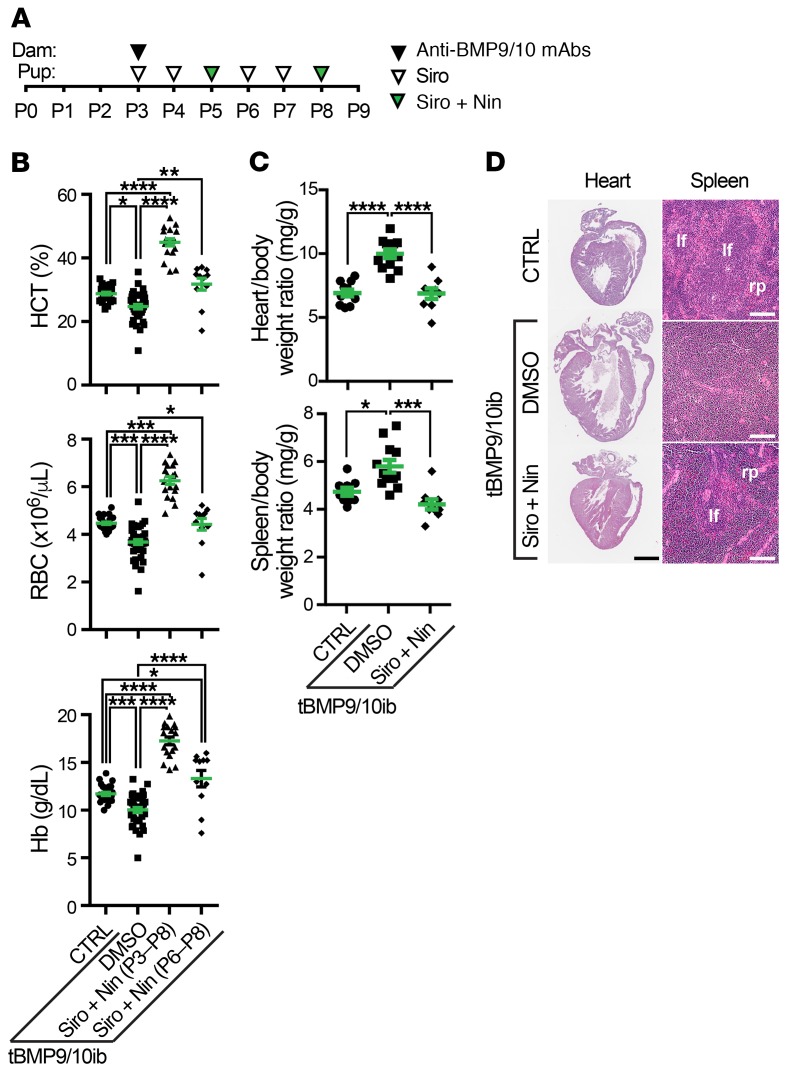
Figure 2. Siro + Nin prevents anemia in tBMP9/10ib mice.
(A) Schematic representation of the protocol for disease induction and drug treatments. Pups were euthanized at P9. (B) Scatter plots measuring hematocrit (HCT) level, red blood cell (RBC) number, and hemoglobin (Hb) level in P9 control (CTRL) and tBMP9/10ib mice treated with Siro + Nin at P3–P8 (as in A) or P6–P8 (see Figure 4A). Data represent individual mice and mean ± SEM (n = 26–29, 35–40, 18, 11 mice for the CTRL, DMSO, Siro + Nin [P3–P8], and Siro + Nin [P6–P8] groups, respectively); HCT and RBC analyses: Kruskal-Wallis test, post hoc Dunn’s multiple-comparisons test; Hb analysis: 1-way ANOVA, Tukey’s multiple-comparisons test. CBC parameters of the controls were within the expected ranges for C57BL/6J neonates. (C and D) P9 mouse heart and spleen analyses of CTRL and tBMP9/10ib mice treated as in A. Heart/body and spleen/body weight ratios are shown in C. Data represent individual mice and mean ± SEM (n = 9–11, 12, and 9 mice for the CTRL, DMSO, and Siro + Nin groups, respectively); 1-way ANOVA, Tukey’s multiple-comparisons test. *P < 0.05; **P < 0.01; ***P < 0.001; ****P < 0.0001. Heart and spleen sections stained with H&E are shown in D. lf, lymphoid follicle; rp, red pulp. Scale bars: 1 mm (D, heart), 10 μm (D, spleen).

