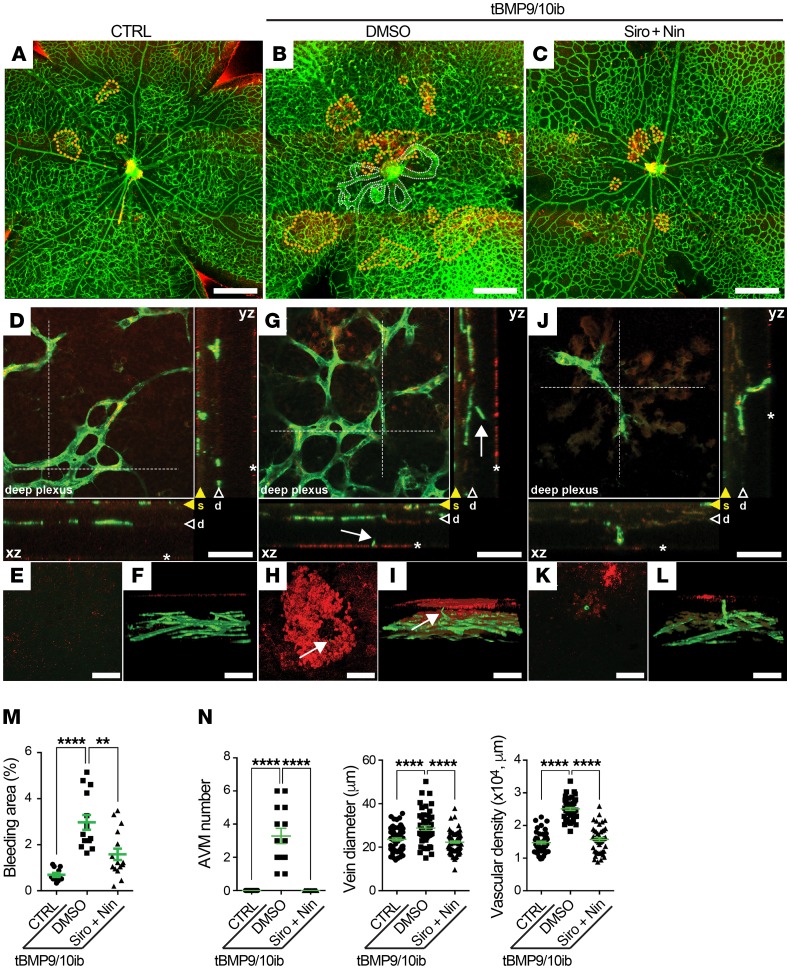
Figure 3. Siro + Nin prevents retinal bleeding in tBMP9/10ib mice.
(A–L) Representative images showing microbleeds (dotted orange lines in A–C) in retinas stained with fluorescent isolectin B4 (green) and anti-Ter119 antibody (red) from control (CTRL; A and D–F) and tBMP9/10ib mice treated with DMSO (B and G–I) or Siro + Nin (C and J–L), as in Figure 2A. Dotted white lines in B indicate AVMs. Higher magnifications in D–L show the extending deeper retinal plexus (arrowheads marked as “d” and orthogonal view [xz and yz planes] of the stack of images at the level of the dotted lines are shown in D, G, and J). Orthogonal views in D, G, and J show superficial vascular plexus (yellow arrowheads marked as “s”), vascular branches projecting to the outer layer of the retina (white arrows), and microbleeds (asterisks). Focal plane views (E, H, and K) and 3D reconstructions (F, I, and L) identify microbleeds. Scale bars: 500 μm (A–C) and 50 μm (D–L). (M) Scatter plot measuring bleeding areas, expressed as a percentage of the retinal vascular area occupied by extravascular accumulation of RBCs in mice treated as in Figure 2A. Data represent mean ± SEM (n = 6, 4, 4 mice for the CTRL, DMSO, and Siro + Nin groups, respectively); 1-way ANOVA, Tukey’s multiple-comparisons test. (N) Scatter plots measuring AVM number, vein diameter, and vascular plexus density in the retina of P9 pups treated as in Figure 2A. Data represent individual retinas and mean ± SEM (n = 7, 7, and 8 mice for the CTRL, DMSO, and Siro + Nin groups, respectively); AVM number and vein diameter analyses: 1-way ANOVA, Tukey’s multiple-comparisons test; vascular density analysis: Kruskal-Wallis test, post hoc Dunn’s multiple-comparisons test. **P < 0.01; ****P < 0.0001.

