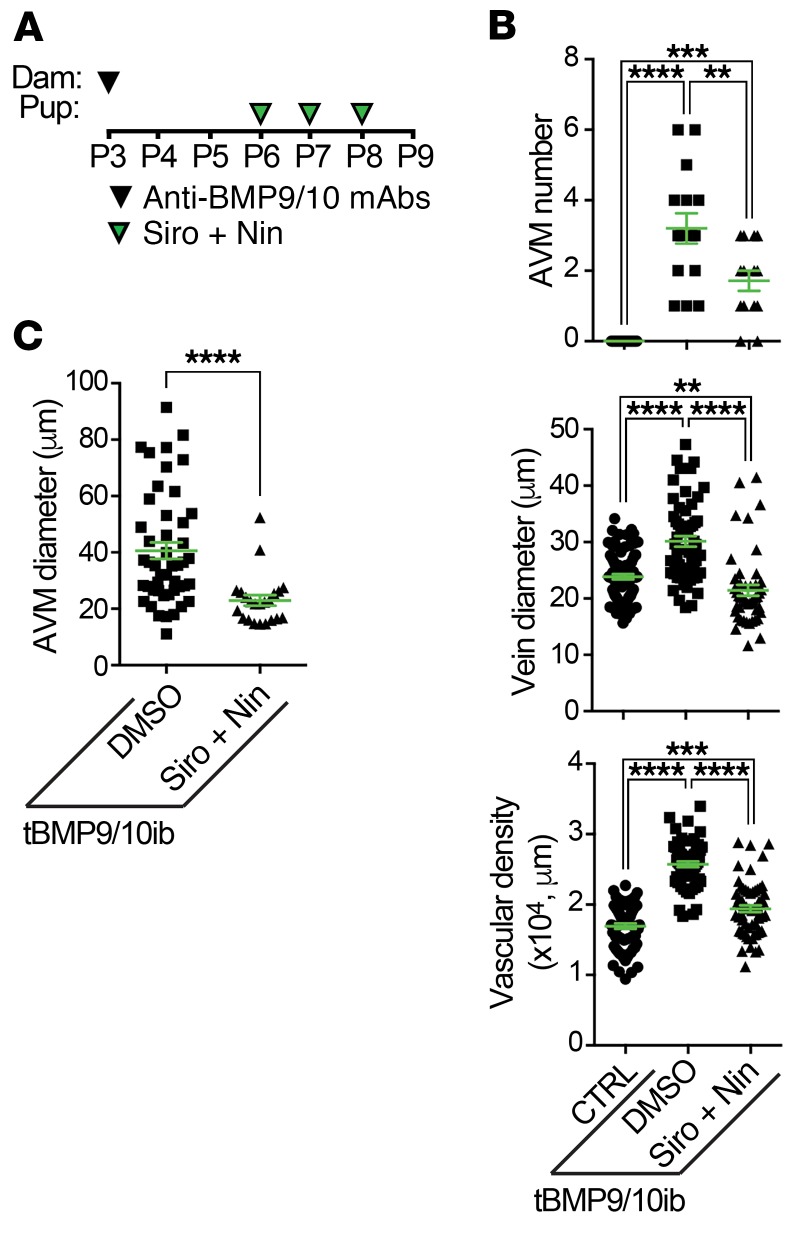
Figure 4. Siro + Nin reverses retinal vascular pathology in tBMP9/10ib mice.
(A) Schematic representation of the protocol for disease induction and drug treatments. Pups were euthanized at P9. (B and C) Scatter plots measuring AVM number, vein diameter, vascular plexus density (B), and AVM diameter (C) in the retina of CTRL and tBMP9/10ib mice treated as in A. Data represent individual retinas and mean ± SEM (n = 9, 8, and 7 mice for the CTRL, DMSO, and Siro + Nin groups, respectively); AVM number and vascular density analyses: 1-way ANOVA, Tukey’s multiple-comparisons test; AVM diameter analysis: Mann-Whitney test; vein diameter analysis: Kruskal-Wallis test, post hoc Dunn’s multiple-comparisons test; **P < 0.01; ***P < 0.001; ****P < 0.0001.

