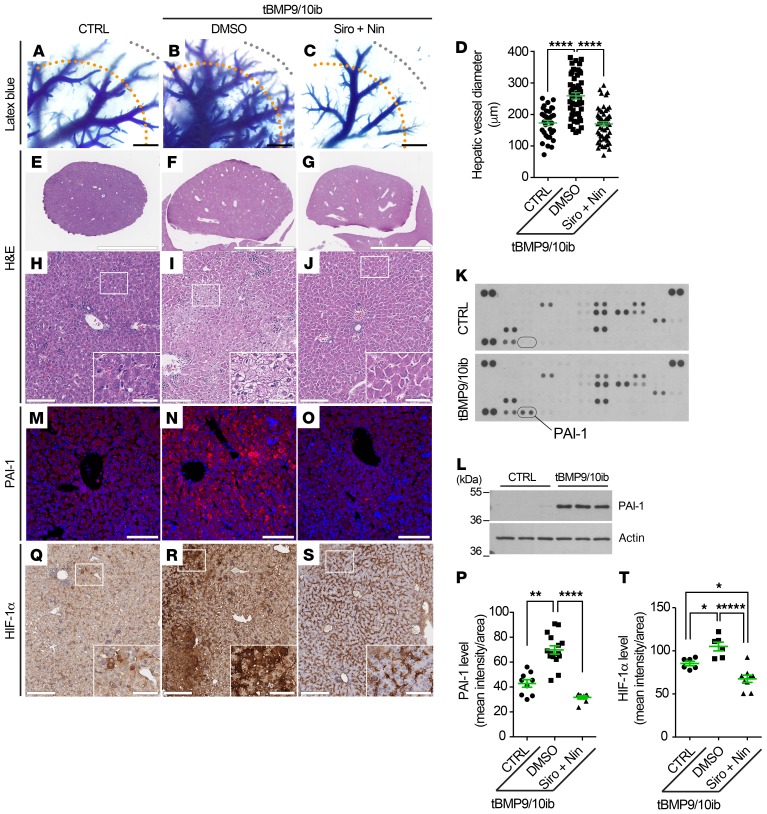
Figure 6. Liver vascular pathology and liver disease in tBMP9/10ib mice: Effects of Siro + Nin treatment.
(A–C) Latex blue dye–perfused livers from tBMP9/10ib mice treated with vehicle (DMSO; B) or Siro + Nin (C), and control mice treated with DMSO (CTRL; A), as in Figure 2A. (D) Scatter plot measuring hepatic vessel diameter. Diameters of these vessels (most likely arterial) were measured at 2,000 μm (orange dotted lines) from the margin of the liver (gray dotted lines). Data represent mean ± SEM (n = 4 livers per condition); Kruskal-Wallis test, post hoc Dunn’s multiple-comparisons test. (E–J) Liver sections stained with H&E at low magnification (E–G) and high magnification (H–J) from tBMP9/10ib and CTRL mice treated as in A–C; insets in H–J indicate magnified areas. (K–O) PAI-1 immunodetection by proteomic array (K, pooled homogenates from n = 3 mice) and Western blot (L, n = 3 mice) of liver homogenates, and by immunofluorescence staining in liver sections (M–O) from mice treated as in A–C. (P) Scatter plot measuring PAI-1 levels, expressed as a mean intensity of fluorescence per sampled area. Data represent mean ± SEM (n = 3 livers per condition); Kruskal-Wallis test, post hoc Dunn’s multiple-comparisons test. (Q–S) HIF-1α IHC in liver sections from mice treated as in A–C; insets indicate magnified areas. Histology data are representative of at least 3 independent mice/condition. Scale bars: 1000 μm (A–C), 3 mm (E–G), 100 μm (H–J, M–O, and Q–S), 35 μm in insets (H–J and Q–S). (T) Scatter plot measuring HIF-1α levels, expressed as a mean intensity of fluorescence per sampled area. Data represent mean ± SEM (n = 3 livers per condition); 1-way ANOVA test, post hoc Tukey’s multiple-comparisons test. *P < 0.05; **P < 0.01; ****P < 0.0001.

