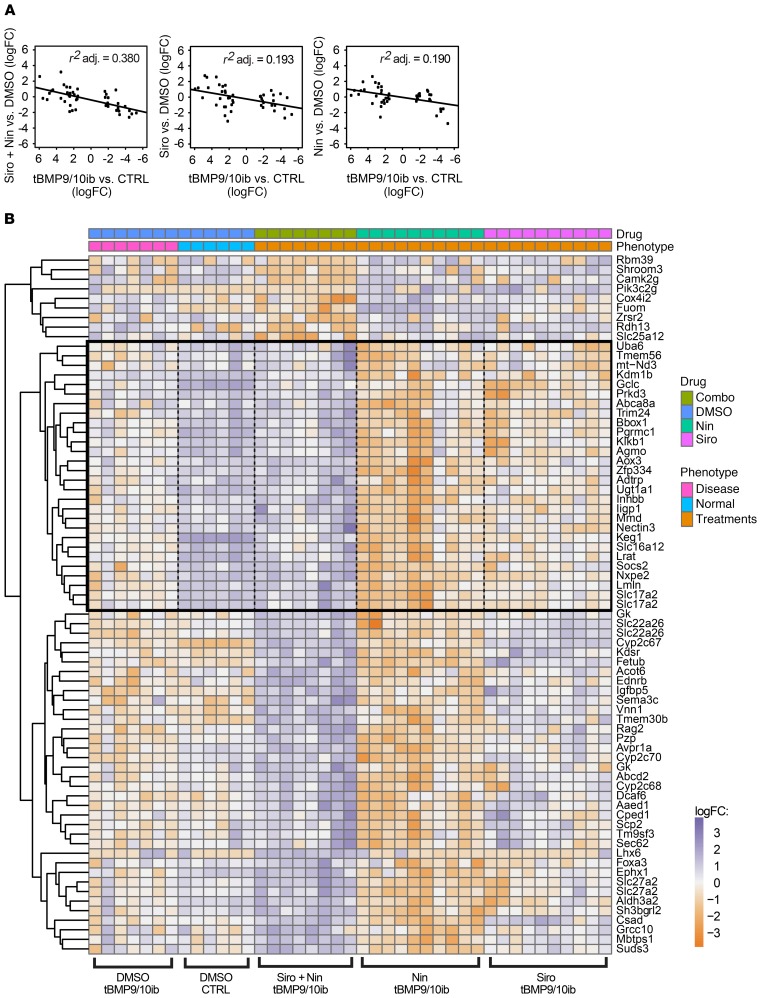
Figure 7. Siro + Nin corrects a gene expression signature detected in the tBMP9/10ib mouse liver.
(A) Scatter plots comparing the liver gene expression changes (logFC, log fold change) observed upon treatment with Siro + Nin or individual drug (Siro or Nin), to the liver gene expression logFCs observed between tBMP9/10ib and normal control (CTRL) mice. Treatments were as in Figure 2A. The negative slope of the plots indicates that each treatment contributed to normalizing the liver gene expression changes seen in tBMP9/10ib versus CTRL mice. Correlation coefficients (r2) indicate a more robust normalization with the drug combination than with individual drugs. (B) Heatmap of liver transcripts synergistically differentially expressed by the drug combination. We identified the genes that responded to the drug combination differently than would be expected, assuming an additive effect of both drugs. A noninteracting drug would produce a COMBO expression equal to the average of the gene expression measured with each treatment (NIN or SIRO). The significant effects that we detected, measured with the statistical contrast COMBO – (NIN + SIRO)/2, produced gene expression changes that deviate from this average independent effect expectation. Transcripts were selected with FDR ≤ 0.5%, log average expression > –5. For reference, liver transcripts in CTRL mice are shown on the heatmap. Gene expression in CTRL mice was used for normalization, but was not used in the selected transcripts that displayed synergistic drug response.

