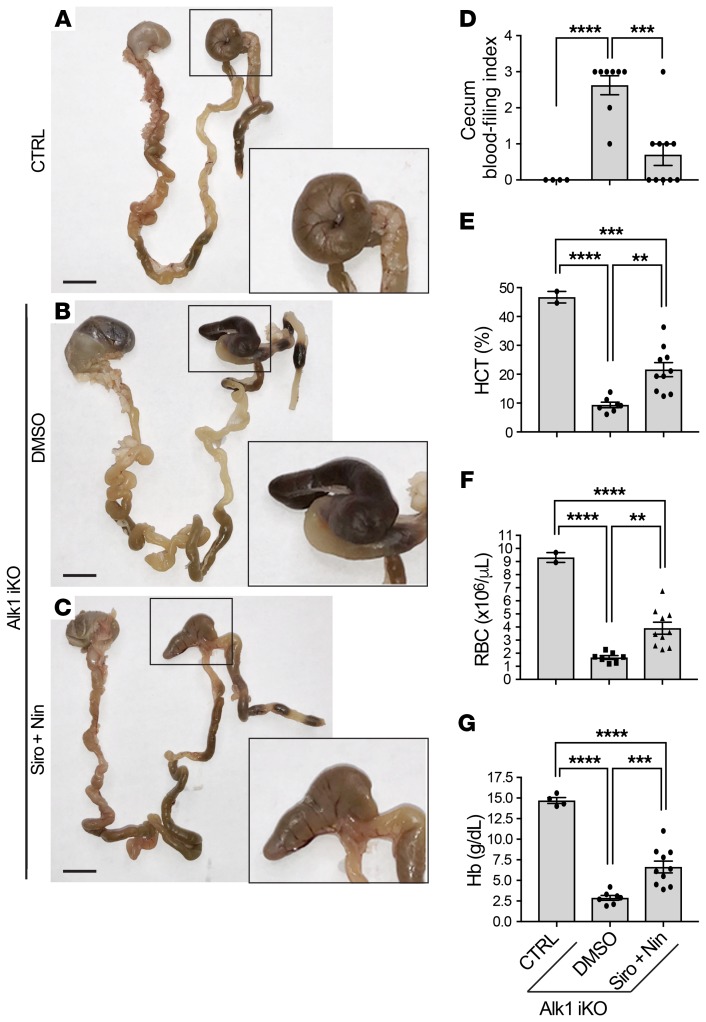
Figure 8. Siro + Nin effectively reduces GI bleeding and ameliorates anemia in adult Alk1-iKO mice.
(A–C) GI tract from stomach to rectum of 2- to 4-month-old CreER-negative control (CTRL; A) and Alk1-iKO mice treated with vehicle (DMSO; B) or Siro + Nin (C). Higher magnifications show the cecum. Scale bars: 10 mm (A–C). (D–G) Scatter plots measuring cecum bleeding index (D), hematocrit (HCT) level (E), red blood cell (RBC) number (F), and hemoglobin (Hb) level (G). Data represent mean ± SEM (n = 2–4, 7–8, and 10 mice for the CTRL, DMSO, and Siro + Nin groups, respectively); 1-way ANOVA (D–F) and 2-way ANOVA (G), Tukey’s multiple-comparisons test. **P < 0.01; ***P < 0.001; ****P < 0.0001. CBC parameters of the controls were within the expected ranges for adult mice.

