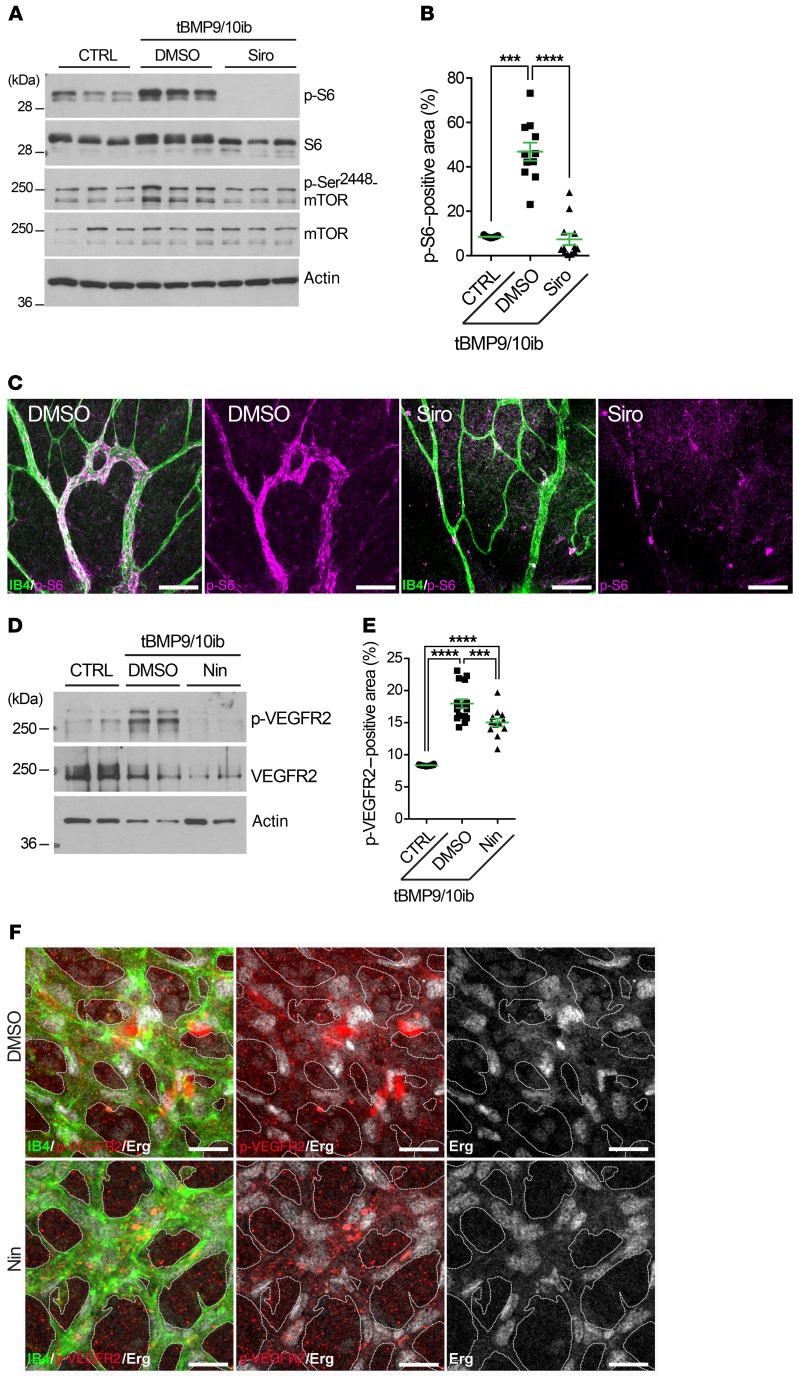
Figure 9. Siro prevents mTOR overactivation, and Nin blocks overactivated VEGFR2 in tBMP9/10ib mice.
(A–F) Control (CTRL) and tBMP9/10ib mice were treated with DMSO and Siro (A–C) or Nin (D–F). Protein homogenates of whole liver from P6 mice (A) and of liver ECs isolated from P9 mice (D) were analyzed by Western blot using antibodies directed against the indicated proteins. Scatter plots show areas positive for p-S6 (B) and p-VEGFR2 (E) analyzed by IHC in the retina of P6 CTRL and tBMP9/10ib mice treated with DMSO and Siro (B) or Nin (E), expressed as a percentage of the retinal vascular area occupied by immunofluorescence staining. Data represent mean ± SEM (n = 4, 3, and 3 mice for the CTRL, DMSO, and Siro [B] or Nin [E] groups, respectively); p-S6 analysis: Kruskal-Wallis test, post hoc Dunn’s multiple-comparisons test; p-VEGFR2 analysis: 1-way ANOVA, Tukey’s multiple-comparisons test. ***P < 0.001; ****P < 0.0001. Representative immunofluorescence images show P6 retinas from tBMP9/10ib mice treated as in B and E stained with fluorescent isolectin B4 (green, C and F), anti-p-S6 (magenta, C), anti–p-VEGFR2 (red, F), and anti-Erg (white, F) antibodies. Scale bars: 100 μm (C) and 50 μm (F).

