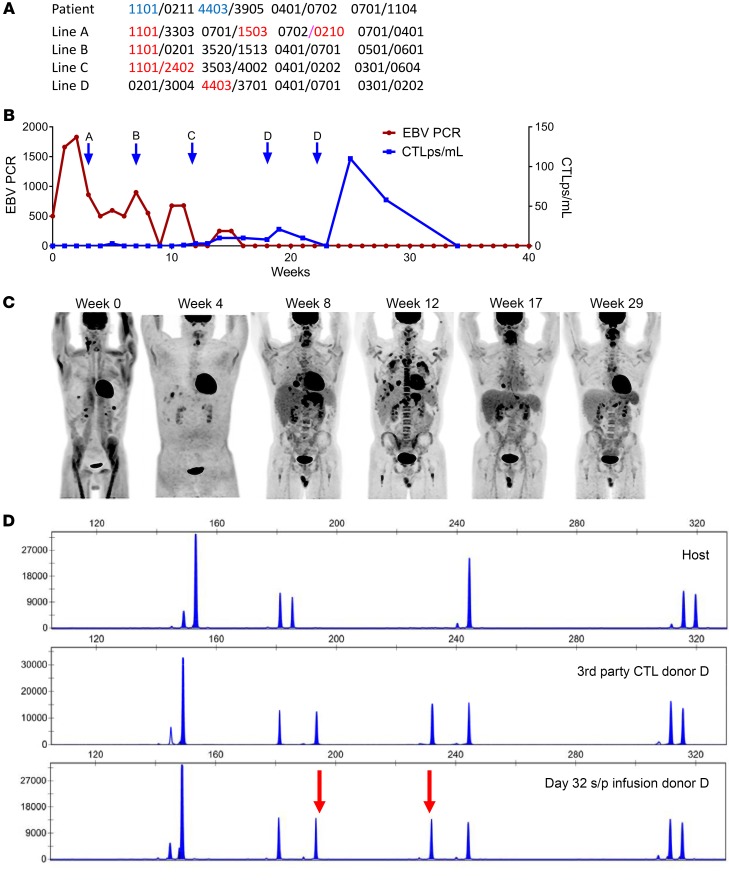
Figure 6. Response to EBV-CTLs restricted by either HLA-A*1101 or HLA-B*4403.
(A) High-resolution typing of the patient and the origin of the EBV+ lymphoma and of the 4 EBV-CTL lines successively infused. Blue type indicates the restricting HLA allele of the EBV-CTL line. (B) Time course of EBV lymphoma and response to successive EBV-CTL lines (EBV PCR as an additional marker of disease). (C) Successive PET scans of disease progression and regression. (D) Distinctive pattern of STRs in EBV-CTLs. Top: Baseline host prior to CTL infusion. Middle: Third-party EBV-CTL donor. Bottom: EBV-specific T cells in blood 32 days after initial infusion and 16 days after third infusion in cycle 1 of EBV-CTLs from donor D, prior to cycle 2. Post-CTL-infusion specimen demonstrating the presence of CTL donor D cells (arrows indicate unique peaks corresponding to donor). s/p, status/post.

