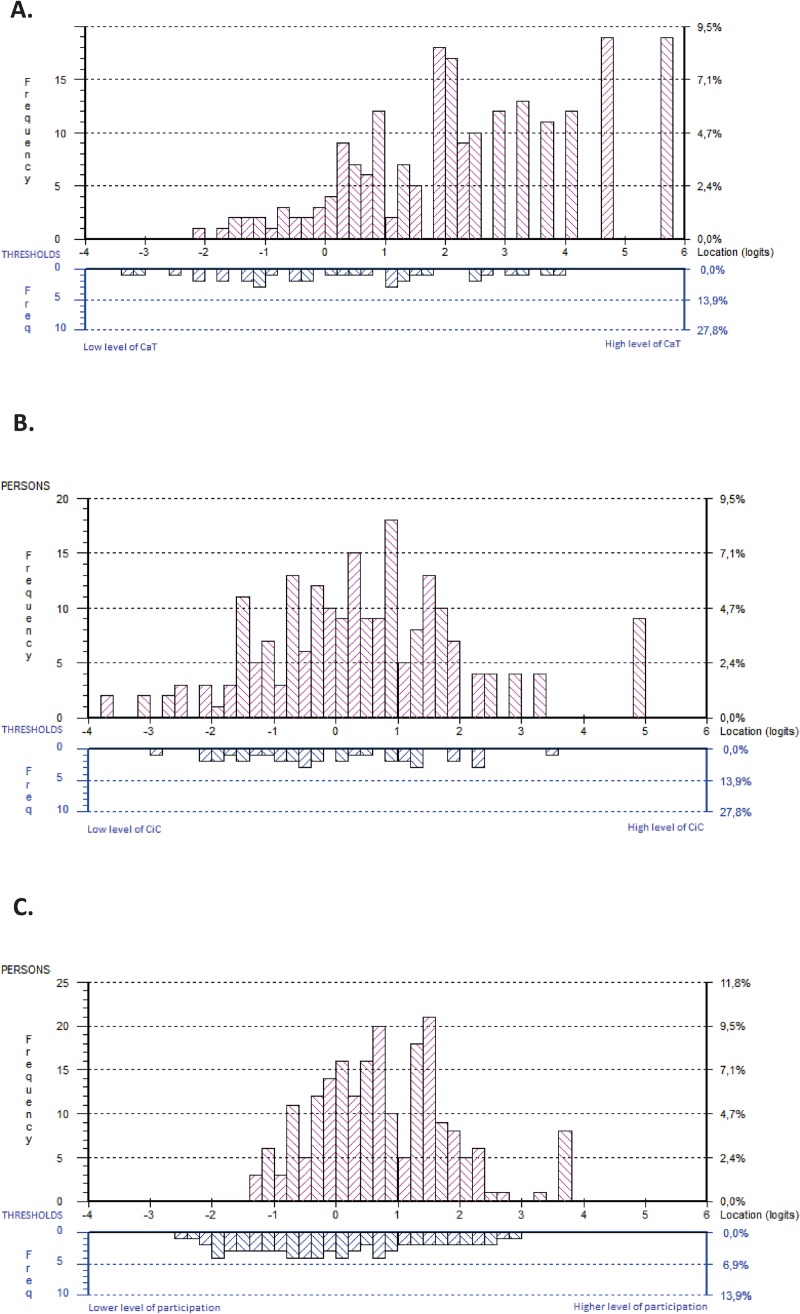
Fig 3.
Distribution of next of kin (upper panel, n = 211) and the item category thresholds (lower panel), for Communication and Trust (CaT, Panel A), Collaboration in Care (CiC, Panel B), and Next of Kin Participation in Care subtests (NoK-PiC, Panel C) on the common logit metric (x-axis; positive values = higher level of CaT/CiC/NoK-PiC). Thresholds are locations at which there is a 50/50 probability of a response in either of two adjacent categories.

