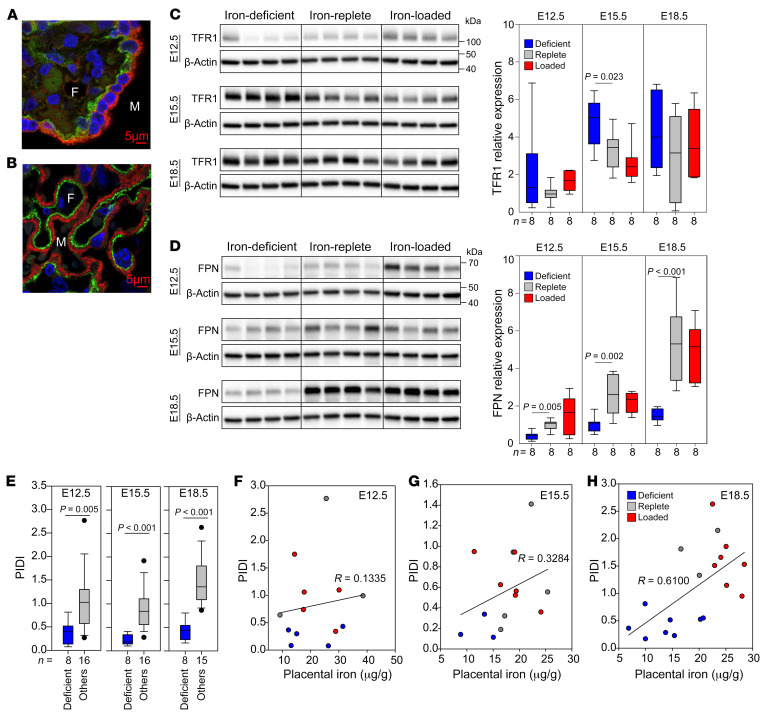
Figure 2. Placental iron transporters respond to changes in maternal iron status.
Immunofluorescence staining of human (A) and mouse (B) placentas for TFR1 (red) and FPN (green) . Original magnification, ×100. Nuclei are blue. M, maternal circulation; F, fetal circulation. Mouse placentas from Figure 1 were analyzed by Western blotting to determine the protein concentration of TFR1 (C) and FPN (D). β-Actin was used as a loading control. Four representative placentas are shown in the Western blots, and a total of 8 placentas (from 3 to 4 different dams per group) were used for quantitation. Data are presented as the mean ± SEM. Statistical differences between groups were determined by 1-way ANOVA for normally distributed values followed by the Holm-Sidak method for multiple comparisons versus the iron-replete control group. (E) The PIDI is the ratio of expression of placental FPN protein to placental TFR1 protein and reflects iron export to the fetus relative to iron import into the placenta from the maternal circulation. Statistical differences were determined using a 2-tailed Student’s t test. (F–H) Correlation of nonheme iron with the PIDI at E12.5, E15.5, and E18.5. The numbers of animals are indicated in the x axes of the box and whisker plots.

