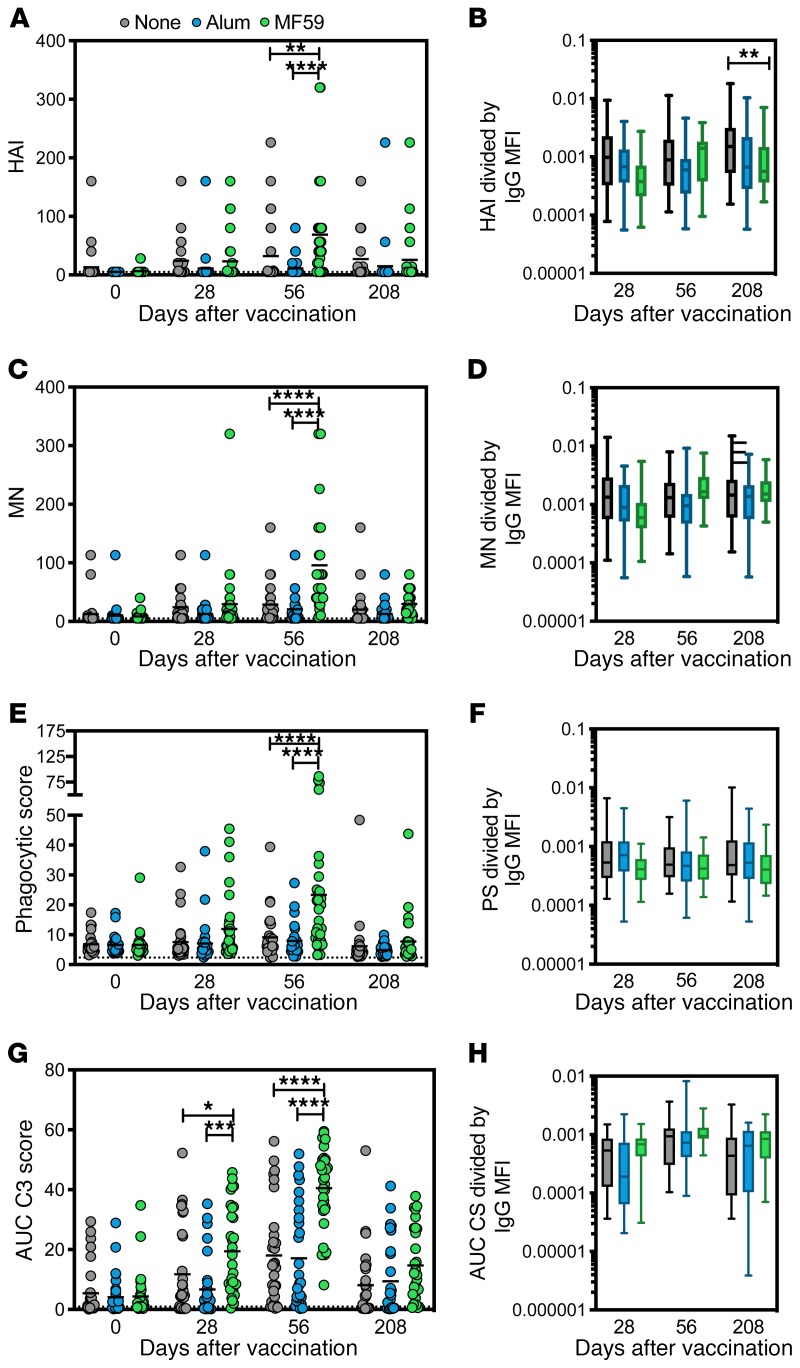
Figure 3. MF59 induces neutralization and specific antibody-dependent innate immune functions along with IgG1 titers.
(A) HAI activity for serum samples in all 3 vaccine groups over 4 time points (11). Each dot represents the average of 2 replicates for 1 serum sample. For all dot plots, bar shows group mean. The dotted line indicates the limit of detection. (B) HAI activity divided by total IgG Luminex MFI as reported in Figure 2 for all 3 vaccine groups during the 3 post-vaccine time points. For all box plots, error bars show minimum to maximum. (C) Microneutralization (MN) activity for serum samples (11). Each dot represents the average of 2 replicates for 1 serum sample. The dotted line indicates the limit of detection. (D) MN activity divided by total IgG Luminex MFI for all 3 vaccine groups. (E) Average ADNP activity for serum samples across 2 healthy WBC donors. Each dot represents the average of 2 replicates for 1 serum sample. The dotted line indicates flu-negative serum background. (F) ADNP activity divided by total IgG Luminex MFI for all 3 vaccine groups. (G) ADCD by serum samples. Each dot represents the average of 2 replicates for 1 serum sample. The dotted line indicates the flu-negative serum background. Values are indicated as the average area under the curve of 3 serum dilutions run in 2 independent replicates. (H) ADCD activity divided by total IgG Luminex MFI. Significance was tested by 2-way ANOVA followed by Tukey’s multiple comparisons test. Significance was only noted within time point. *P < 0.05, **P < 0.01, ***P < 0.001, ****P < 0.0001.

