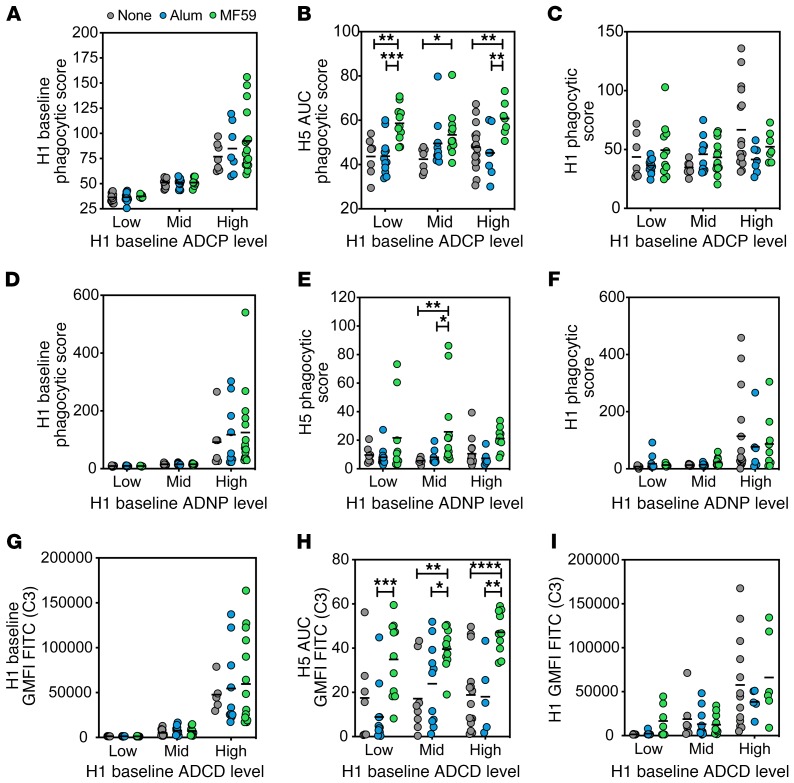
Figure 6. MF59-induced antibody functionality is not influenced by prevaccination H1-specific immunity.
(A) Samples were grouped into low, mid, or high based on their baseline (day 0) H1-specific ADCP. The dot plot indicates grouping strategy of baseline H1-specific ADCP among each vaccine group. (B) H5-specific ADCP at peak immunogenicity (day 56) for H1 baseline ADCP groups. (C) H1-specific ADCP at peak immunogenicity for each baseline reactivity group by vaccine adjuvant. (D) Samples were grouped into low, mid, or high based on their baseline (day 0) H1-specific ADNP. The dot plot indicates the grouping strategy of baseline H1-specific ADNP among each vaccine group. (E) H5-specific ADNP at peak immunogenicity (day 56) for H1 baseline ADNP groups. (F) H1-specific ADNP at peak immunogenicity for each baseline reactivity group by vaccine adjuvant. (G) Samples were grouped into low, mid, or high based on their baseline (day 0) H1-specific ADCD. Dot plot indicates grouping strategy of baseline H1-specific ADCD among each vaccine group. (H) H5-specific ADCD at peak immunogenicity (day 56) for H1 baseline ADCD groups. (I) H1-specific ADCD at peak immunogenicity for each baseline reactivity group by vaccine adjuvant. For all dot plots, each dot represents the average of 2 replicates for 1 serum sample, and bar shows group mean. Significance was tested by 2-way ANOVA followed by Tukey’s multiple comparisons test and is noted only within time point. *P < 0.05, **P < 0.01, ***P < 0.001, ****P < 0.0001.

