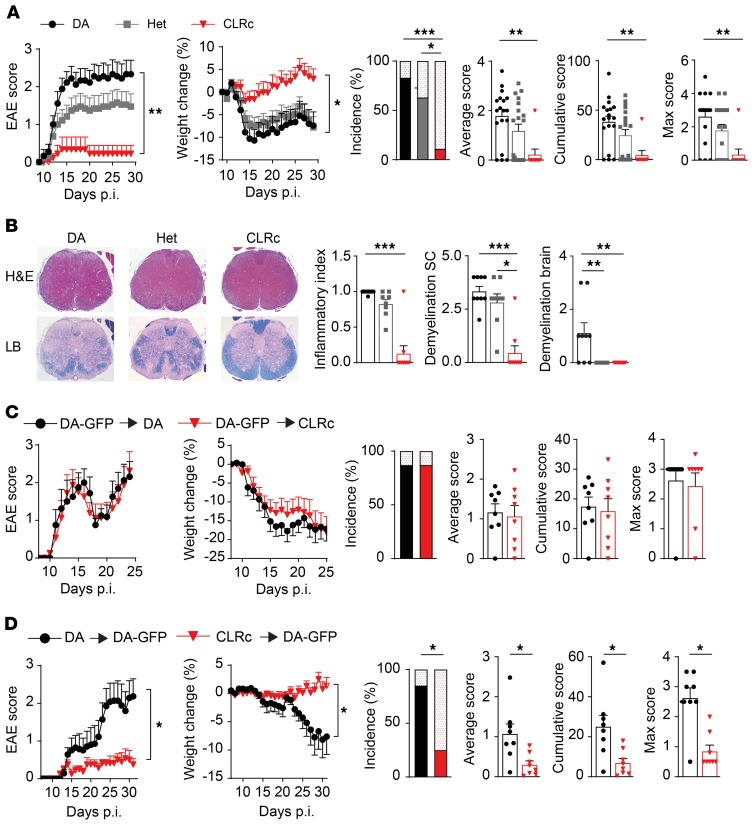
Figure 1. CLRc rats are protected from EAE in a peripheral immune cell–dependent manner.
Homozygous (CLRc) and heterozygous (Het) congenic rats and their littermate DA controls were immunized with MOG and followed for signs of disease. (A) Clinical signs of EAE and disease parameters in DA littermate controls (n = 18), Het (n = 19), and CLRc rats (n = 9) (representative of 3 experiments). For EAE incidence, the upper dotted bars represent unaffected rats, whereas the lower plain bars represent affected rats. (B) Histopathological analysis of spinal cord (SC) on day 29. Left: Representative images of H&E and Luxol fast blue (LB) staining (original magnification, ×40). Right: Quantification of inflammation and demyelination for DA (n = 9), Het (n = 8), and CLRc rats (n = 9). (C and D) Lethally irradiated rats were transplanted with bone marrow (BM) from donor animals, reconstituted for 2 months, and then immunized with MOG. Clinical signs of EAE and disease parameters were assessed in (C) DA or CLRc recipient rats transplanted with DA-GFP BM (DA-GFP → DA [n = 8] or DA-GFP → CLRc [n = 8]) and (D) DA-GFP recipients transplanted with DA or CLRc BM (CLRc → DA-GFP [n = 8] and DA → DA-GFP [n = 7]). Data are presented as the mean ± SEM. The following statistical tests were used: 1-way ANOVA with Dunnett’s multiple-comparisons test (A, for area under the curve [AUC] of clinical EAE and weight change), Kruskal-Wallis test with Dunn’s multiple-comparisons test (A [for average, cumulative, and max EAE score] and B), unpaired 2-tailed t test (C and D, for AUC of clinical EAE and weight change), Mann-Whitney U test (C and D, for average, cumulative, and max EAE score), and χ2 test (A, C, and D, for EAE incidence). *P < 0.05; **P < 0.01; ***P < 0.001.

