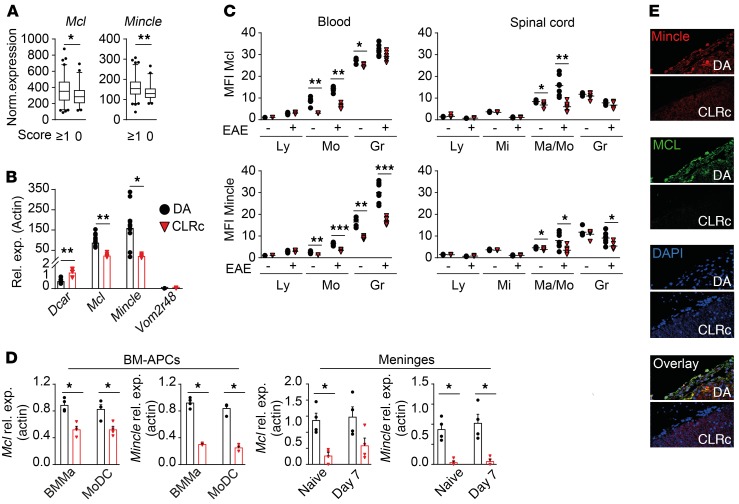
Figure 3. CLRc regulates expression of Mcl and Mincle in monocytes and macrophages.
(A) Expression of Mcl and Mincle assessed by microarray in spleens of (DA × PVG) × DA backcrossed rats subjected to EAE, affected (n = 95, score ≥1) and nonaffected (n = 51, score 0). (B) Gene expression in DA (n = 6) and CLRc (n = 6) spleens determined by qPCR (representative of 2 experiments). (C) Flow cytometry analysis of cells isolated from blood and spinal cord of naive DA (n = 5) and CLRc (n = 5), as well as DA (n = 7) and CLRc (n = 6) rats on day 13 p.i. assessing Mcl and Mincle protein expression by mean fluorescence intensity (MFI) (representative of 2 experiments). Ly, lymphocyte; Mi, microglia; Mo/Ma, monocyte/macrophage; Gr, granulocyte. (D) qPCR analysis of Mcl and Mincle expression in BMMas and MoDCs (BM-APCs) derived in vitro and meninges from naive and 7-day-p.i. DA (n = 4) and CLRc (n = 4) rats (representative of 2 experiments). (E) Immunofluorescent staining of rat spinal cord 11 days p.i. Representative images of staining for Mcl, Mincle, and nuclei (DAPI) (original magnification, ×40). Data are presented as the mean ± SEM or box plots with whiskers representing 5th to 95th percentile. All comparisons were analyzed with the Mann-Whitney U test. *P < 0.05; **P < 0.01; ***P < 0.001.

