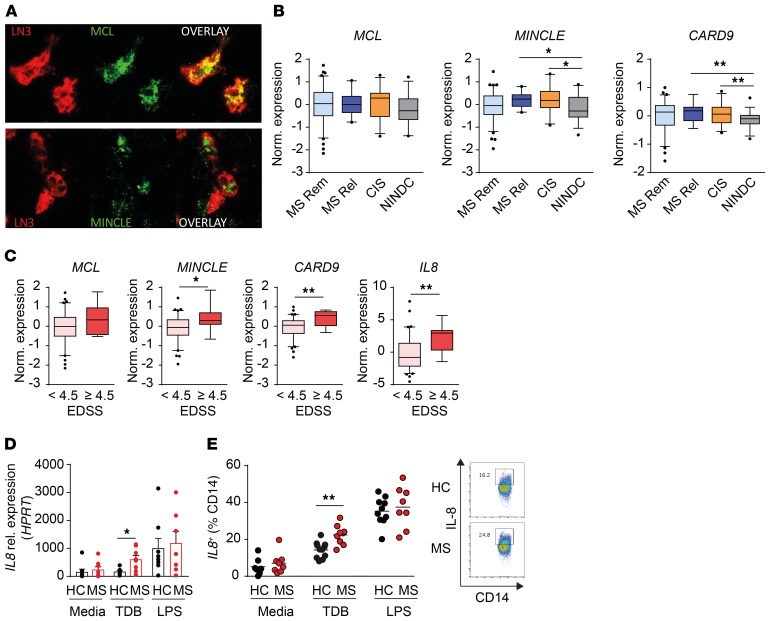
Figure 6. The MCL/ MINCLE signaling pathway is upregulated in MS patients and correlates with disease activity and progression.
(A) Representative immunofluorescent staining of MS lesions: MCL or MINCLE (green), HLA-DR expression (LN3, red). Original magnification, ×40. (B and C) Gene expression analysis of PBMCs from MS patients and noninflammatory neurological disease controls (NINDCs) using RNA sequencing. (B) Expression of MCL, MINCLE, and CARD9 comparing MS patients in remission (n = 73), MS patients in relapse (n = 14), CIS patients (n = 28), and NINDCs (n = 36). (C) Expression of MCL, MINCLE, CARD9, and IL8 according to Expanded Disability Status Scale (EDSS) score. (D) PBMCs from RRMS patients in relapse (n = 9) and healthy controls (HC) (n = 11) were stimulated in vitro with TDB, LPS, or media. qPCR analysis of IL8 expression of adherent CD14+ fraction after 24-hour stimulation. (E) Flow cytometry analysis of IL-8 production gated on CD14+ monocytes after 48-hour stimulation. Data are presented as the mean ± SEM or box plots with whiskers representing 5th to 95th percentile. The following statistical tests were used: 1-way ANOVA with Dunnett’s multiple-comparisons test (B), Mann-Whitney U test (C and D), and unpaired 2-tailed t test (E). *P < 0.05; **P < 0.01.

