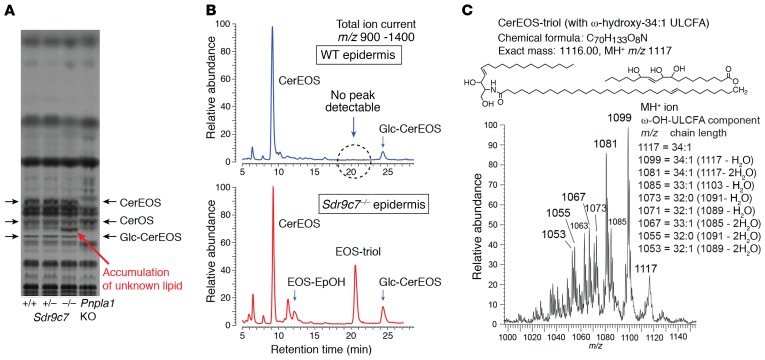
Figure 3. Epidermal accumulation of EOS-triol in Sdr9c7 null mice.
(A) Representative TLC analysis of lipids extracted from Sdr9c7+/+, Sdr9c7+/–, and Sdr9c7–/– epidermis. Sdr9c7–/– mice show the appearance of a major new polar lipid running between CerOS and Glc-CerEOS. In all 3 Sdr9c7 genotypes, note the normal appearance of CerEOS, which is absent in the Pnpla1 knockout (right lane). The experiment was repeated 4 times with consistent results. (B) Normal-phase LC-MS analysis of WT and knockout Sdr9c7 epidermal lipids. The chromatograms show the total ion current profile (m/z 950–1350) of LC-MS analysis of MeOH/CHCl3 epidermal extracts of WT (top panel, blue profile), and Sdr9c7–/– (bottom panel, red profile) using an Advantage 5-μm silica column (250 × 4.6 mm) run with gradient elution of hexane/isopropanol/glacial acetic acid (95:5:0.1) to hexane/isopropanol/glacial acetic acid (75:25:0.1) over 30 minutes using a Waters Alliance 2690 HPLC system coupled to a TSQ Vantage mass spectrometer. Note the prominent peak at approximately 20.5 minutes in the knockout, which is undetectable using this methodology in the WT. (C) Partial mass spectrum (m/z 1000–1150) of the 20.5-minute peak, with ion fragments identifying the product as CerEOS containing esterified trihydroxy-C18:1 fatty acid (EOS-triol).

