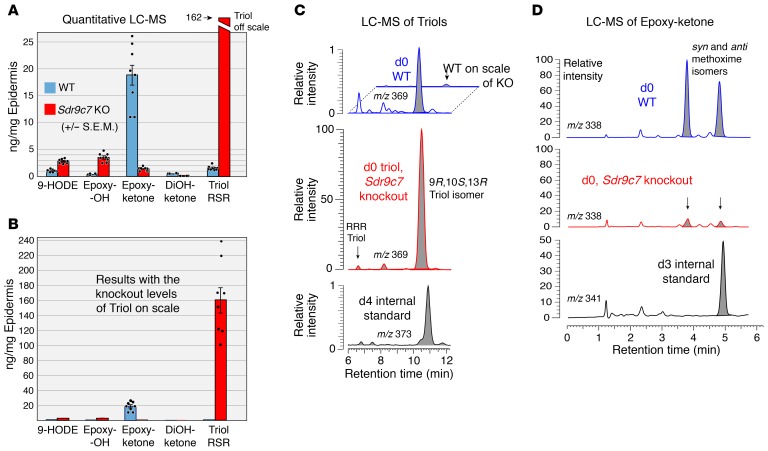
Figure 4. Quantitative LC-MS of oxidized linoleates esterified in WT and Sdr9c7–/– (Sdr9c7 KO) epidermis.
(A) Quantitation of 9-HODE, 9,10-trans-11E-13-hydroxy (Epoxy-OH), 9,10-trans-epoxy-11E-13-ketone (Epoxy-ketone), 9,10-dihydroxy-11E-13-ketone (DiOH-ketone), and 9R,10S,13R-trihydroxy-linoleate (Triol RSR). (B) The same data from A, shown on scale with the Sdr9c7 knockout levels of Triol RSR. Results are expressed in ng/mg epidermis (mean ± SEM, n = 8, P < 0.001 for all pairs of WT compared with knockout, except for DiOH-ketone [n = 4, P < 0.05]). (C) LC-MS ion chromatograms illustrating analysis of linoleate triols: top panel, blue trace shows the triols in WT; middle panel, red trace shows the 100-fold higher levels of Triol RSR in Sdr9c7–/– compared with WT; lower panel, black trace shows the d4 triol internal standard used for quantitation. (D) LC-MS ion chromatograms illustrating analysis of the Epoxy-ketone, with WT (top, blue trace), knockout (middle, red trace), and d3 epoxy-ketone internal standard (lower, black trace). Samples are analyzed with the 13-ketone derivatized to a 13-methoxime, which gives syn and anti isomers (the 2 peaks in the d0 channel); the d3 internal standard was added as a single methoxime isomer, hence only one peak appears in the lower chromatogram. Oxidized lipids were isolated for LC-MS analysis as described in the Supplemental Data.

