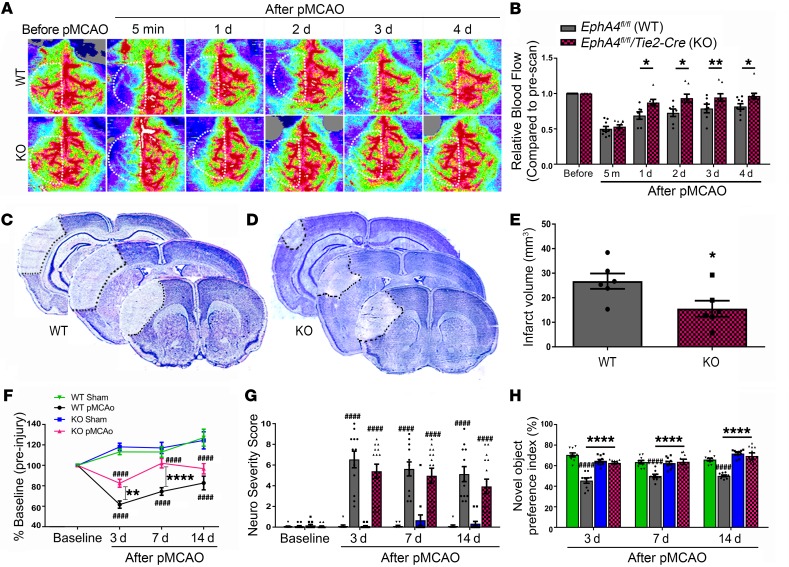
Figure 1. Increased CBF and reduced infarct volume in EC-specific KO mice following pMCAO.
(A) Laser doppler images before and after pMCAO. Panel shows representative images from EphA4fl/fl WT and EphA4fl/fl/Tie2::Cre KO mice before and after pMCAO. (B) Quantified analysis shows increased CBF in KO compared with WT mice; n = 7–10. (C) Representative serial Nissl images of 3 bregma levels in WT and (D) KO mice 1 day after pMCAO. (E) Quantified infarct volume shows a significant reduction in infarct volume in KO compared with WT mice; n = 6. (F) Rotarod assessment of WT and KO mice. KO mice performed significantly better than WT mice 3 and 7 days after stroke. (G) NSS and (H) NOR were analyzed 3–14 days after pMCAO. Two-way ANOVA with Bonferroni’s post hoc test; n = 9–17. *P < 0.05, ****P < 0.0001 compared with corresponding WT mice; ####P < 0.0001 compared with corresponding sham mice. White dotted lines in A indicate standardized ROI used for CBF quantification of each sample.

