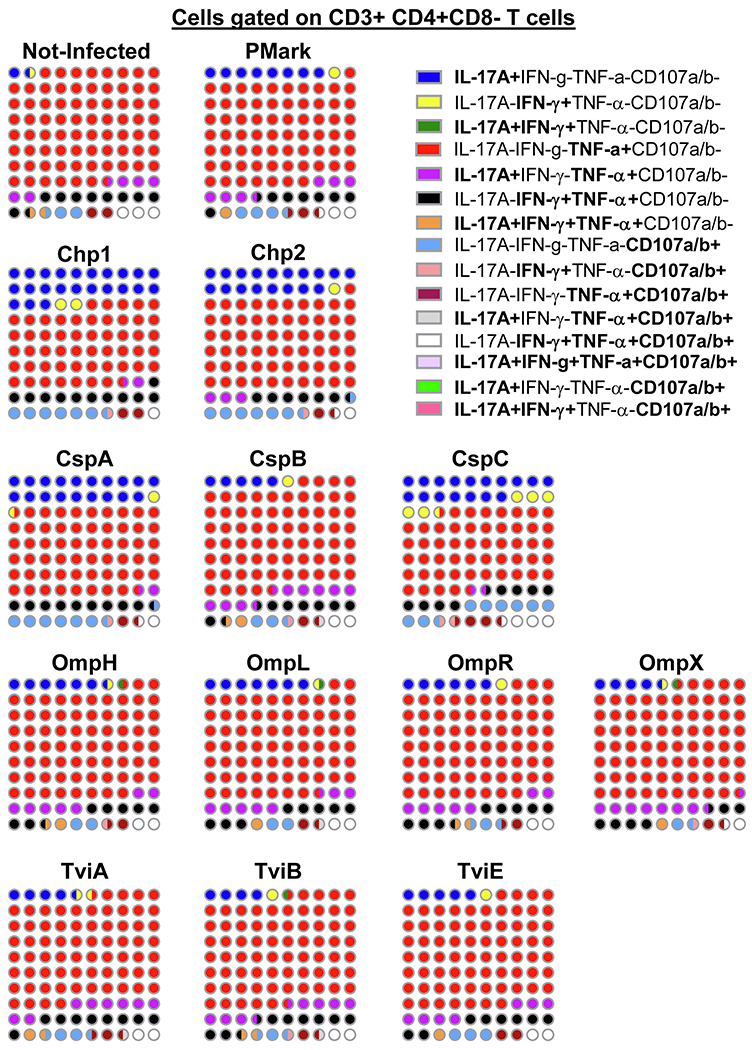
Fig. 4. Frequencies of mono and multifunctional CD4+ T-cells.

FCOM, an analysis tool contained in the WinList software package, was used to automatically reduce multiparameter data to a series of multiple event acquisition gates, one for each of the 15 possible sub-phenotypes of CD4+ T-cell multifunctionality. Lymphocytes were gated-out based on forward scatter height vs. forward scatter area. A “dump” channel was used to eliminate dead cells (Yevid+) as well as macrophages/monocytes (CD14+), B lymphocytes (CD19+) and targets (CD45+) from the analysis. This was followed by additional gating on CD3 and CD4 to identify single and multifunctional CD4+ T-cells. Combinations with frequency values that were zero were ignored. The data represents an average of 4 volunteers with sufficient number of positive events to allow for a detailed analysis of the T-memory subsets of the responding populations. Data presented as 10X10 matrixes in which each circle represents 1% of the population, color-coded as described in the legend. Bi-colored circles represent 0.5%.
