
Fig. 6. Memory status of the mono and multifunctional CD4+ T-cells.
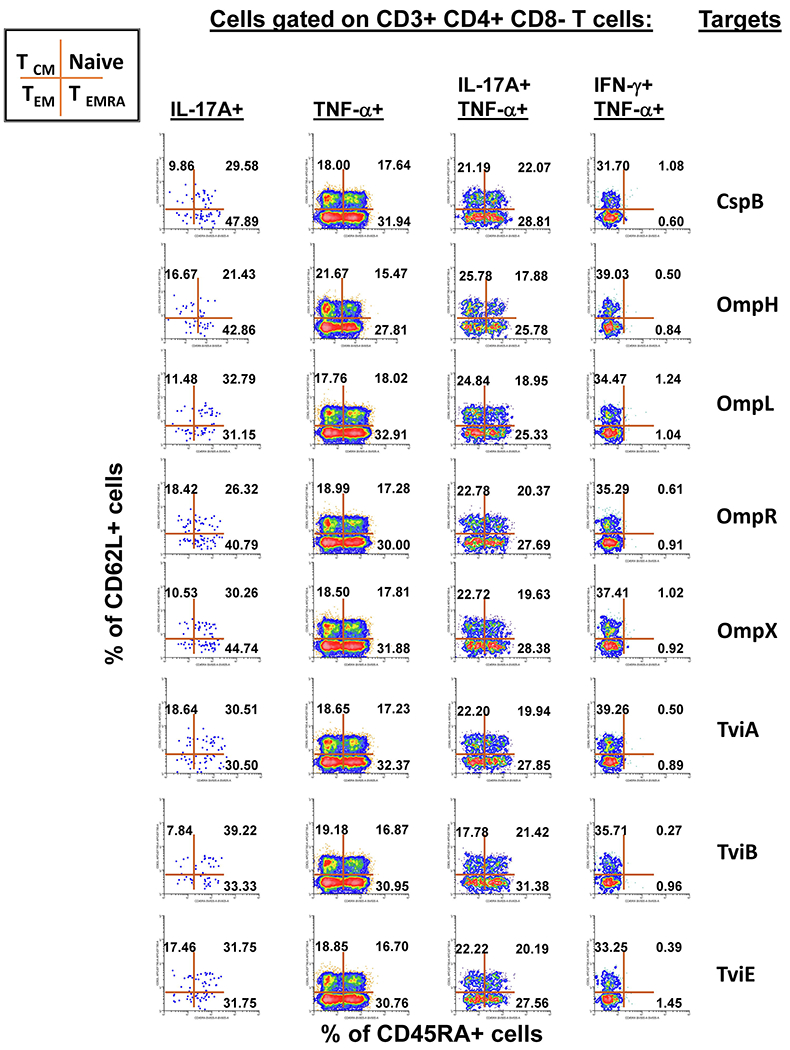
Subsequent gates on the mono and multifunctional CD4+ T-cell subsets described in Fig. 4 were used to identify the memory status among each of the 15 defined sub-phenotypes of CD4+ cells. The data is representative of one experiment/one volunteer showing mono-functional or multi-functional CD4+ T-cell responses to eight recombinant E. coli expressing S. Typhi/Hly (CspB, OmpH, OmpL, OmpR, OmpX, TviA, TviB, and TviE) proteins at a multiplicity of infection (MOI) of 1:30. This figure illustrates a gating strategy in which CD4+ T-cells are further categorized based on the expression of CD45RA and CD62L markers. Cells in each resulting quadrant of the dot plot are then categorized in 4 subpopulations: central memory (CD45RA−CD62L+, TCM), naive (CD45RA+CD62L+, Naive), effector memory (CD45RA−CD62L−, TEM), effector memory expressing CD45RA (CD45RA+CD62L−, TEMRA). The 4 selected populations are those that were dominant in the volunteers who responded to stimulation with S. Typhi proteins, exhibiting sufficient number of positive events to allow downstream analyses. Numbers represent the percentage of positive cells in the respective quadrant.