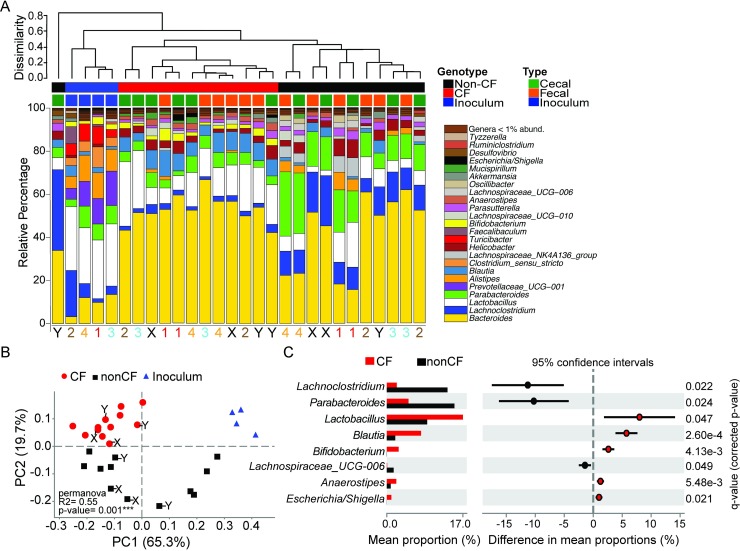
Fig 3. Mutations in CFTR gene influence the composition of the gut microbiota.
The composition of the fecal and cecal microbiota were assessed in CF and non-CF GF recipient mice 1–3 months following FMT with SPF C57BL/6J feces by sequencing of the V3-V4 hypervariable regions of the 16S rRNA gene. See also S1 Fig. (A) Bar graph represents the relative abundances of major genera identified within each sample. Hierarchical clustering was performed based on Bray-Curtis distance, according to ASV distribution at the genus level. The experiment was repeated four times over the course of a year and the numbers (and colors) at the bottom of each column (Red, Brown, Blue, Orange) correspond to an experimental cohort. Fecal and cecal contents were pooled at equal volumes for pair-housed, age, sex, and genotype matched mice within a study prior to DNA extraction (N = 2 mice per genotype per experiment). Black X and Y samples indicate samples from two experiments that used the equivalent of the CF cecal sample of experiment 4 as donor material for the FMT. (B) Multidimensional scaling by ASV’s abundance demonstrate significant clustering by genotype (PERMANOVA, p <0.05, with R2 = 0.55). Red circles represent CF whereas black squares represent non-CF samples. Blue triangles are inoculum samples of SPF C57BL6/J mice bred inhouse. (C) Genera significantly enriched or depleted in CF mice and associated q-values from experiments 1–4 (i.e. excluding the X and Y samples) as determined by White’s non-parametric t-test; CI method: Welch’s inverted; multiple test correction method: Benjamini & Hochberg.

