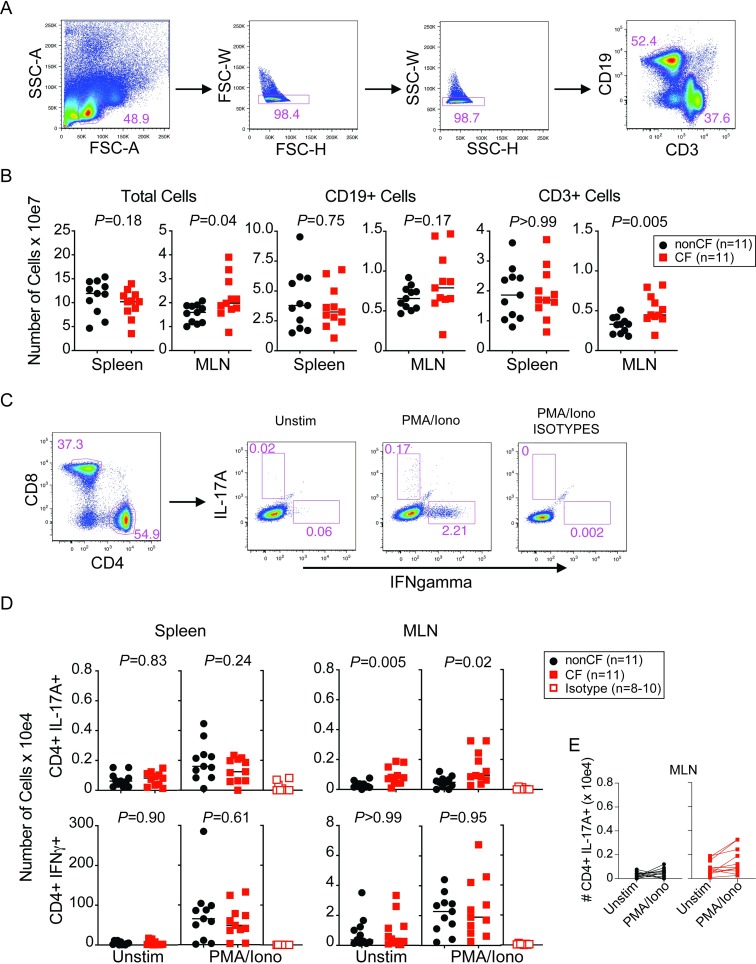
Fig 4. GF CF mice exhibit elevated TH17 cells in the MLN compared to non-CF controls.
(A) Gating strategy used to enumerate cell numbers (B) of T (CD3+) and B (CD19+) cells in the Spleen and MLN from GF CF and non-CF mice (N = 11 mice per genotype). (C) Gating strategy to identify IFNgamma+ or IL-17A+ CD4+ T-cells following ~5 hours of stimulation in the presence of PMA / Ionomycin. Note that the gating strategy in this figure (including Panel (A)) comes from an FMT mouse to show IL-17A production. (D) Cell counts per mouse (N = 11 mice per genotype, and N = 8 MLN and N = 10 Spleen samples that were also stained with isotype control antibodies in parallel). (E) Data from (D) but showing IL-17A production linking Unstim to PMA/Ionomycin stimulation for each mouse. Data were analyzed by pairwise comparison between CF and non-CF animals within a group by Mann-Whitney U test.

