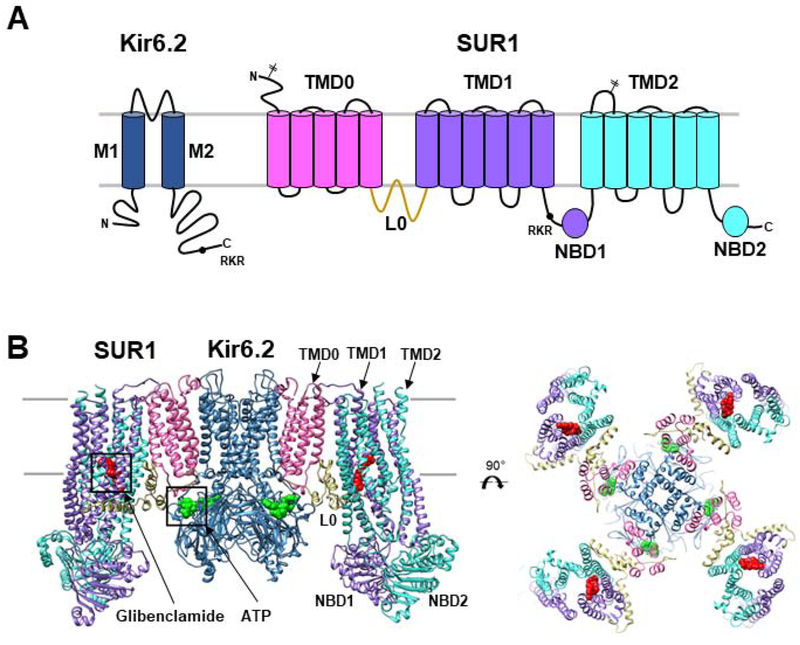
Figure 1. KATP channel architecture.
(A) Topology of SUR1 and Kir6.2 with domains labeled and colored to match the 3D structures shown below. Locations of the two N-linked glycosylation sites (branched sticks) in SUR1 and the RKR ER retention signal (black circle) in SUR1 and Kir6.2 are marked. (B) Structural model (side view and top view) of the KATP channel with glibenclamide bound to SUR1 shown as red spheres and ATP bound to Kir6.2 in green spheres. Model (PDB: 6BAA) is built using a 3.7Å cryoEM map (EMD-7073).

