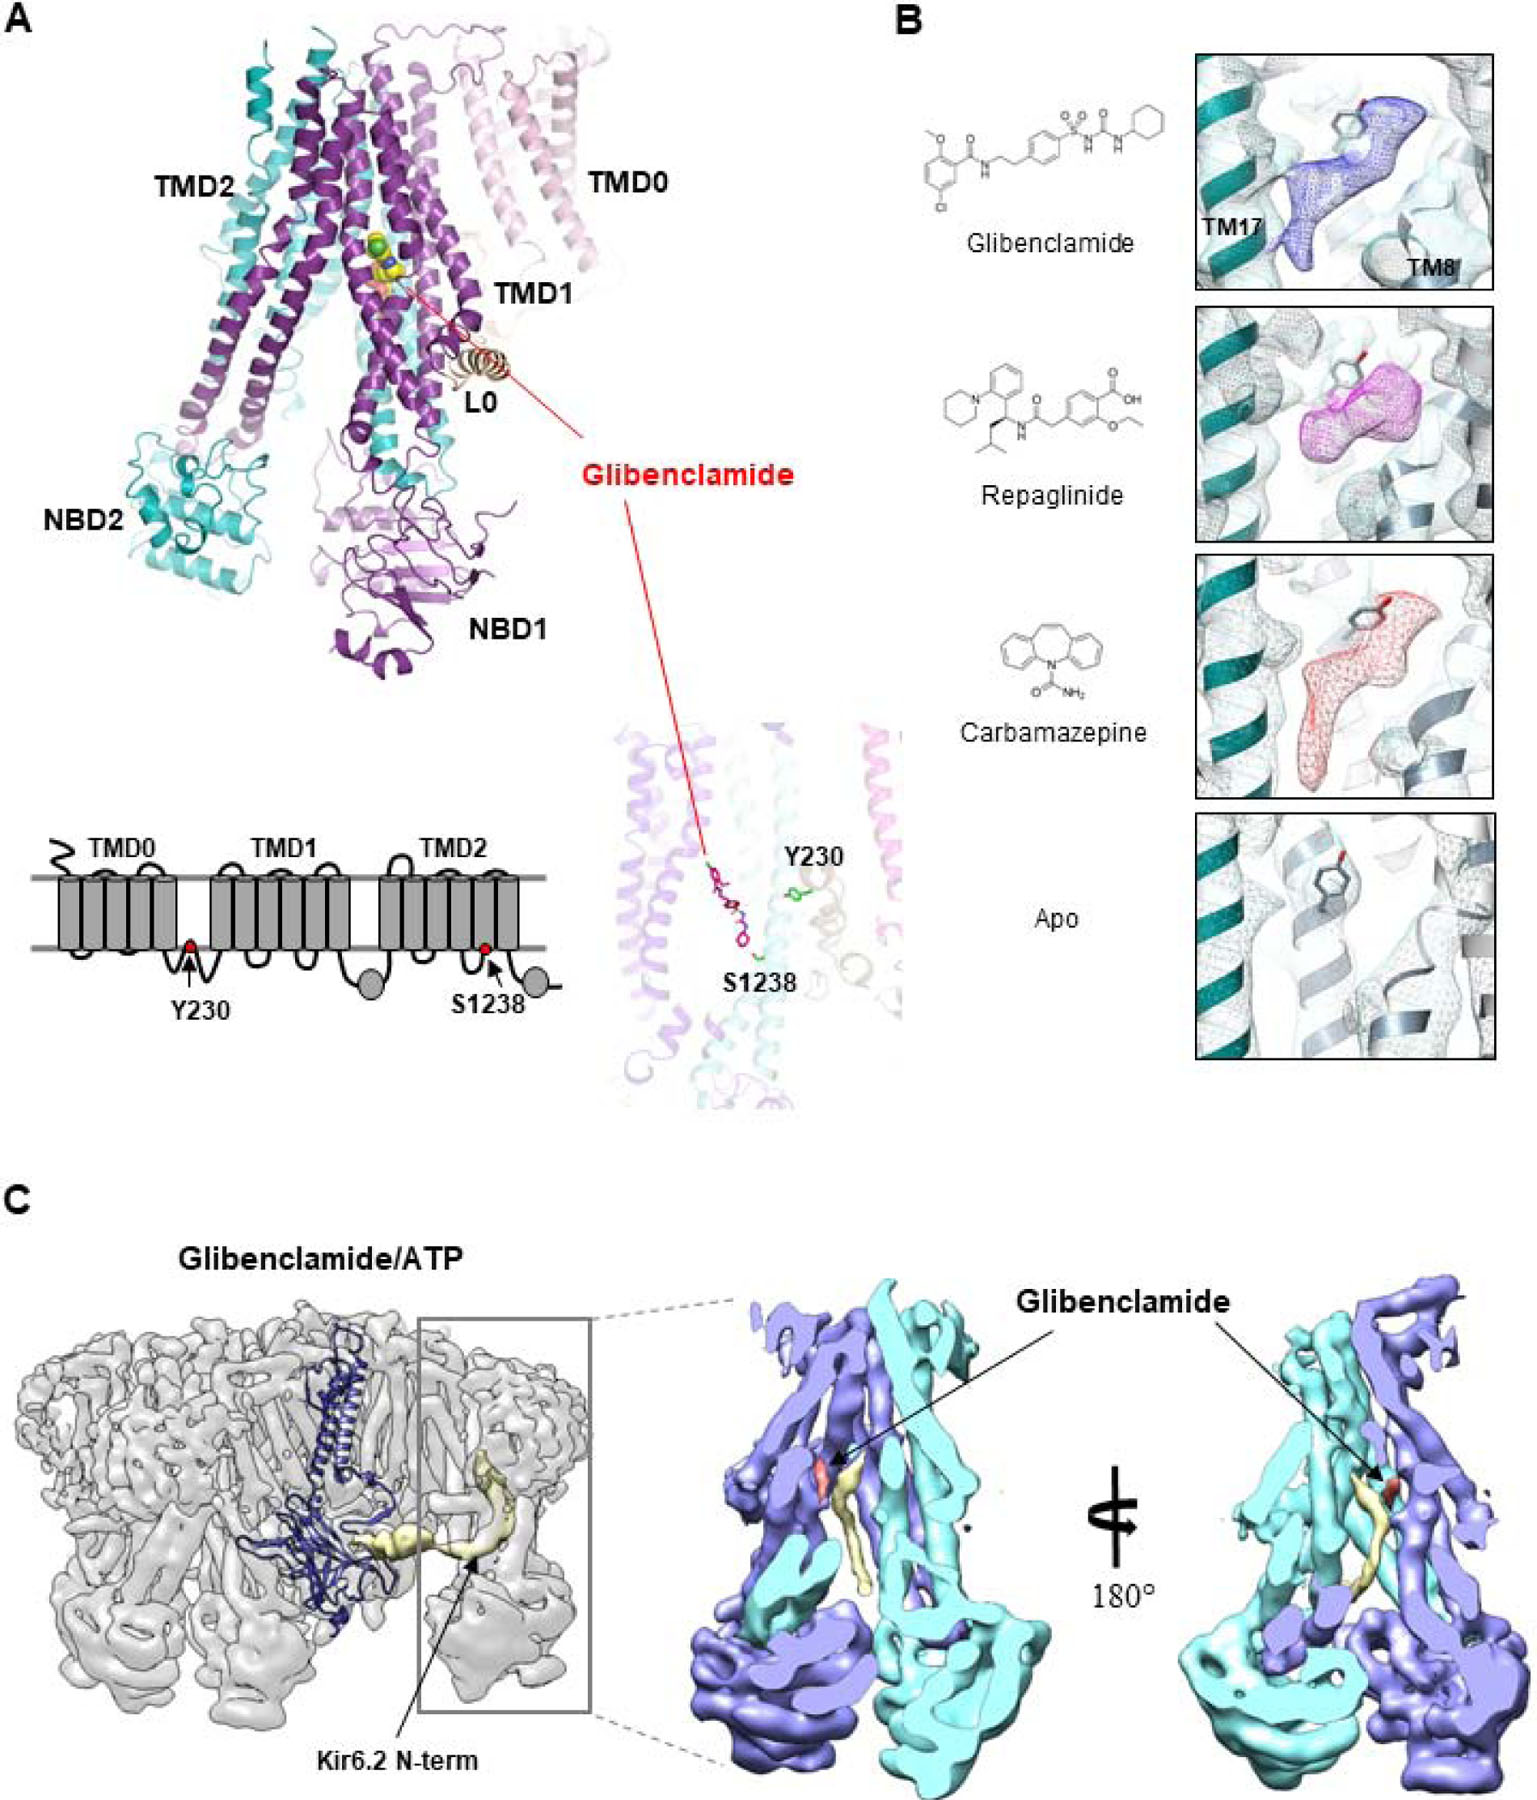
Figure 3. Pharmacological chaperone binding pocket.

(A) Top: Structure of the SUR1 subunit showing the location of the bound glibenclamide (space-filling model). Bottom: 2D topology model (left) and 3D structure of SUR1 showing the location of the two residues previously implicated in glibenclamide (shown in stick model). (B) Chemical structures of pharmacological chaperones and their corresponding cryoEM densities in the SUR1 binding pocket. The empty binding pocket in the apo state is shown for comparison. (C) CryoEM map of the channel in complex with glibenclamide and ATP showing the density of the Kir6.2 N-term (gold) extending into the SUR1 ABC core central cavity. The structure of a Kir6.2 subunit is shown to illustrate the connectivity between the low resolution Kir6.2 N-terminus (filtered to 6Å) density with the modeled Kir6.2 structure. Right: Two slice views of the SUR1 ABC core showing the spatial relationship between glibenclamide and the Kir6.2 N-terminus.
