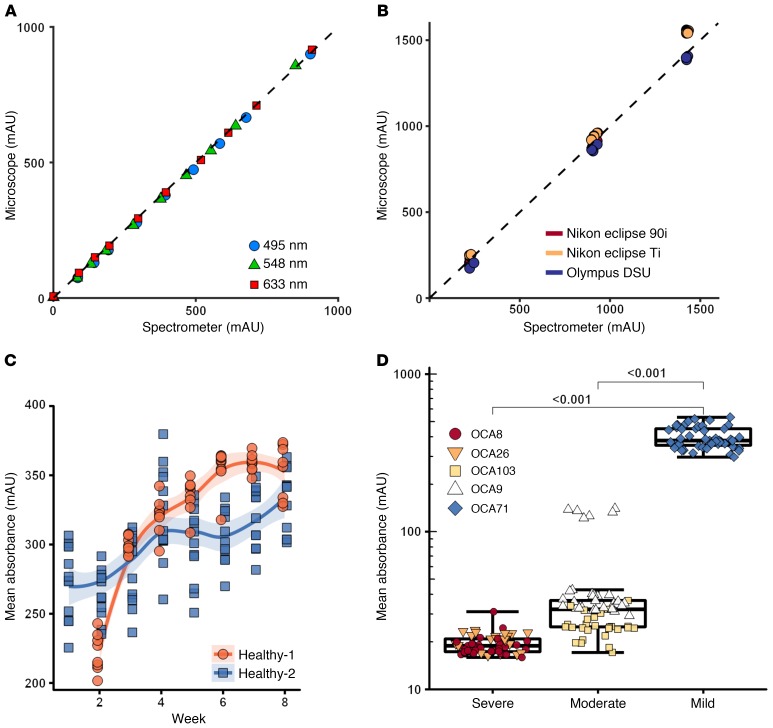
Figure 2. Assessment of QBAM reproducibility, accuracy, and robustness.
(A) ND filters were analyzed with a spectrometer and compared with absorbance values from QBAM images. n = 3 replicates per point; error bars = 3 SD (smaller than size of data point). (B) Three different ND filters were imaged on 3 different microscopes using different color filters to determine the comparability of absorbance values between different configurations (e.g., filters, cameras, etc.). n = 3 replicates per point[ error bars = 3 SD (smaller than size of data point). (C) iPSC-RPE from 2 healthy patients were imaged over time with QBAM (n = 12 wells per donor) to observe changes in pigmentation as iPSC-RPE mature. Each data point represents the mean of 12 images captured from 1 well. Shaded region represents 95% SEM. (D) iPSC-RPE from patients with OCA were imaged to determine whether QBAM was able to recapitulate clinical presentation (OCA patients have iPSC-RPE with low pigment). Each data point represents 1 FOV of each sample. Whiskers represent 3 times the inner quartile range; boxes show 25% and 75% quantiles. n = 9 replicates for severe; n = 10 replicates for moderate; and n = 8 replicates for mild. A linear mixed effect model controlling for multiple images being taken per well was performed for albino cells.

