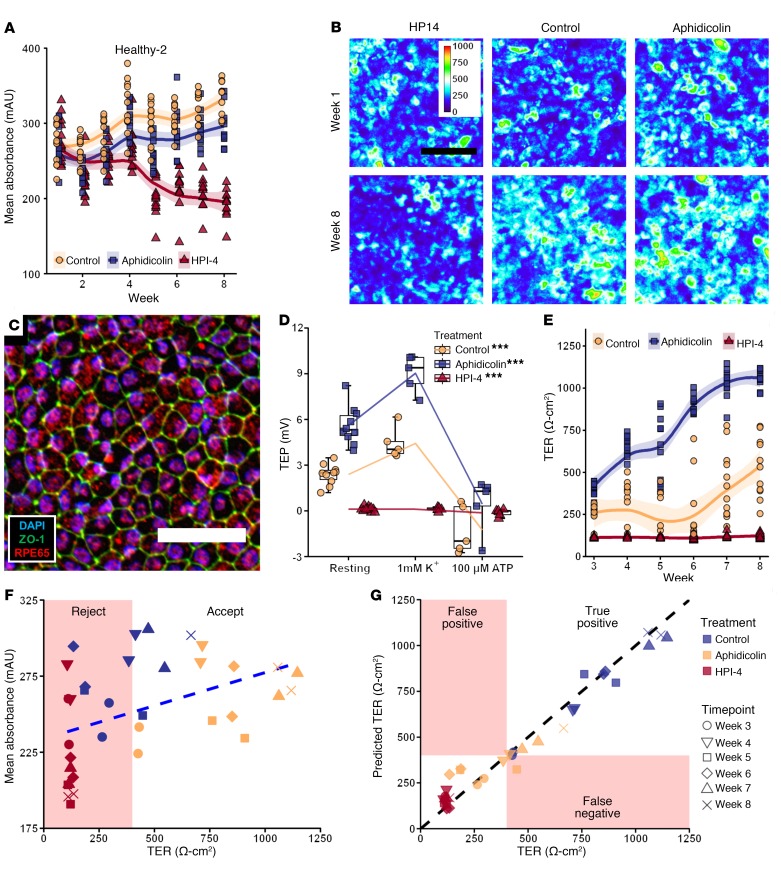
Figure 3. Prediction of healthy-2 iPSC-RPE function from QBAM images.
(A) Plot of the mean absorbance from 12 images collected in each well over time. Shaded region represents 95% SEM. (B) Representative QBAM images of live iPSC-RPE prior to treatment (week 1, top row) and after 8 weeks of maturation (bottom row) in the presence of a maturation promoter (aphidicolin), a maturation inhibitor (HPI4), or neither (control). Color calibration bar shows units in mAU. (C) Fluorescent labeling of a control sample from healthy-2 iPSC-RPE after 8 weeks of culture, where blue shows cell nuclei (DAPI), green shows cell borders (ZO-1), and red shows an RPE-specific maturation marker (RPE65). Scale bars: 100 μm (B); 50 μm (C). (D) Evaluation of iPSC-RPE TEP in response to an ATP challenge. ***P < 0.005. Whiskers represent 4 times the inner quartile range, and boxes show 25% and 75% quantiles. (E) Plot of TER over time for every replicate starting at week 3. Shaded region represents 95% SEM. (F) Plot of TER against mean image absorbance (R2 = 0.19, blue dashed line shows linear regression). (G) Plot of TER predictions from a DNN (DNN-F) against the measured TER (R2 = 0.97, black line represents a perfect prediction from the DNN). See also Supplemental Figure 3 for additional functional testing, and Supplemental Figure 4 for DNN-F prediction of VEGF secretion. n = 12 replicate wells per treatment and 12 images per replicate for all graphs. Linear mixed effect models controlling for repeated measures from a single well over time and for multiple images being taken per well were performed for A, D, and E.

