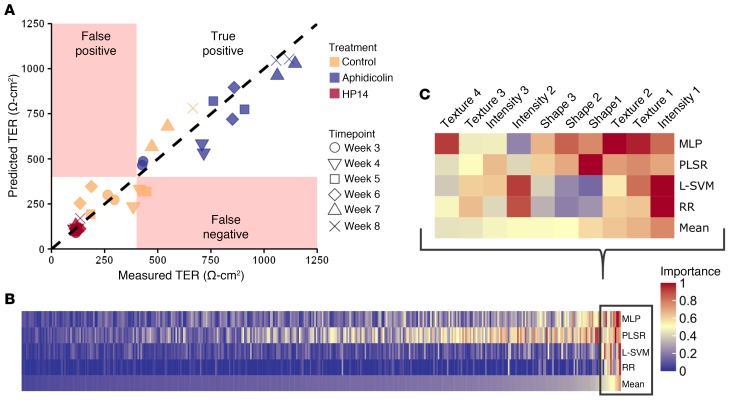
Figure 5. Traditional machine-learning algorithms’ ability to predict iPSC-RPE function (healthy-2) from cell-image features isolated by segmentations of QBAM images.
(A) Plot of TER predictions from MLP against the measured TER (R2 = 0.94, black dashed line represents a perfect prediction from the MLP). Red regions indicate areas that would be less than 400 Ω·cm2, which was set as the lot release criteria for these cells. n = 12 replicate wells per treatment and 12 images per replicate. (B) Heatmap of all cell images feature importance sorted by mean importance across all features. (C) Top 10 most important features from the heatmap in B enlarged so that individual classes of features could be identified. Red indicates most important features for predicting cell TER, while blue indicates the least important features. See also Supplemental Figure 6.

