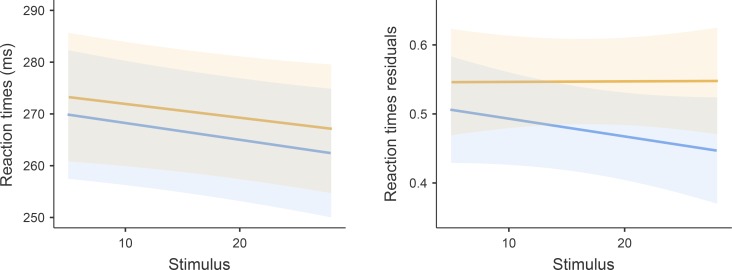
Fig 2. RT measures before and after the fatiguing task.
Blue line represents the PRE condition, and the orange line represents POST condition for RT (left panel) and RT residuals (right panel). Semi-transparent areas indicate the 95% CI of the fixed effect of the difference in RT and RT residuals between PRE and POST the fatiguing task.

