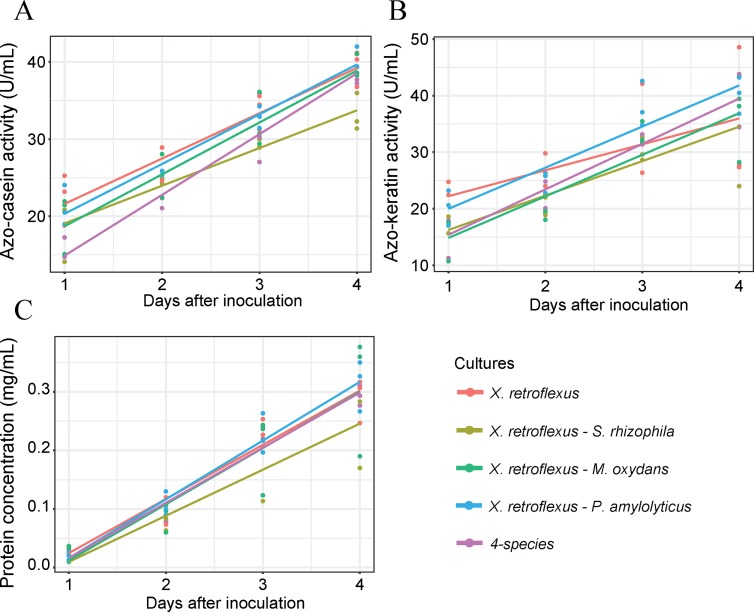
Fig 3. Enzyme and protein production by the different co-cultures during growth.
Lines represent a linear regression of three biological replicates across sampling time. A) Protease production by different co-cultures using azo-casein as substrate. One unit protease activity was defined (U) as the amount of protein that increased the absorbance by 0.01. B) Keratinase production by different co-cultures using azo-keratin as substrate. One unit keratinase activity was defined as the amount of protein that increases the absorbance by 0.01 under given conditions. C) Protein production from degraded keratin by different co-cultures. Bradford assay was used for protein quantification with BSA as standard.

