
Fig. 2. Device configuration and absorption distribution.
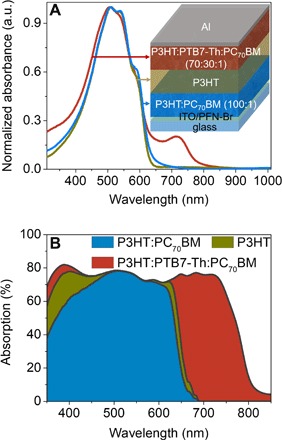
(A) Normalized absorption spectra measured for a binary blend P3HT:PC70BM (100:1) layer, a pristine P3HT layer, and a ternary blend P3HT:PTB7-Th:PC70BM (70:30:1) layer. Inset: Schematic diagram illustrating the cross-sectional view of the OPD, having a layer configuration comprising ITO/PFN-Br/P3HT:PC70BM (300 nm)/P3HT (320 nm)/P3HT:PTB7-Th:PC70BM (500 nm)/Al. a.u., arbitrary unit. (B) The absorption spectra calculated for 300-nm-thick binary blend P3HT:PC70BM (100:1), 320-nm-thick pristine P3HT, and 500-nm-thick ternary blend P3HT:PTB7-Th:PC70BM (70:30:1) layers.