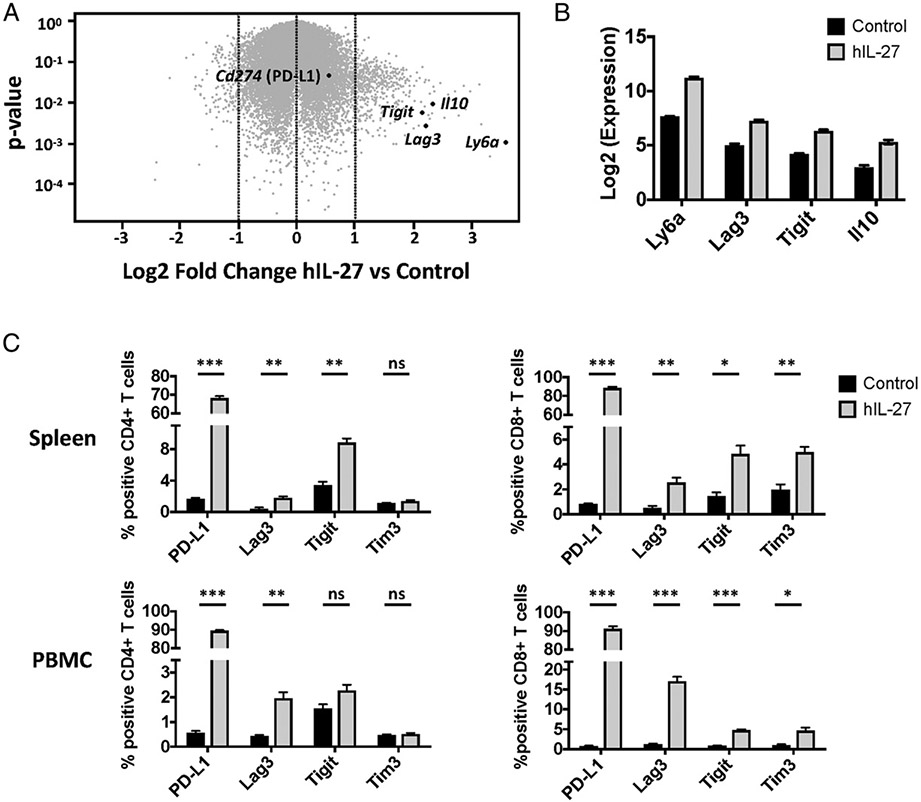
FIGURE 1. Overexpression of IL-27 upregulates expression of multiple IR by T cells in vivo.
(A–C) Mice were treated with IL-27 minicircles, and then splenocytes were analyzed by microarray. (A) Volcano plot showing cutoff of genes modulated by log2 fold change >1.0. Genes of interest are highlighted in red. (B) Expression of select immunomodulatory genes. (C) Mice were treated with IL-27 minicircles and IR expression by CD4+ and CD8+ T cells from spleens, and PBMC was assessed by flow cytometry. Three mice per group. Error bars indicate SEM. Statistical significance was determined by using Student t test. ns; p > 0.05, *p < 0.05, **p < 0.01,***p < 0.001.

