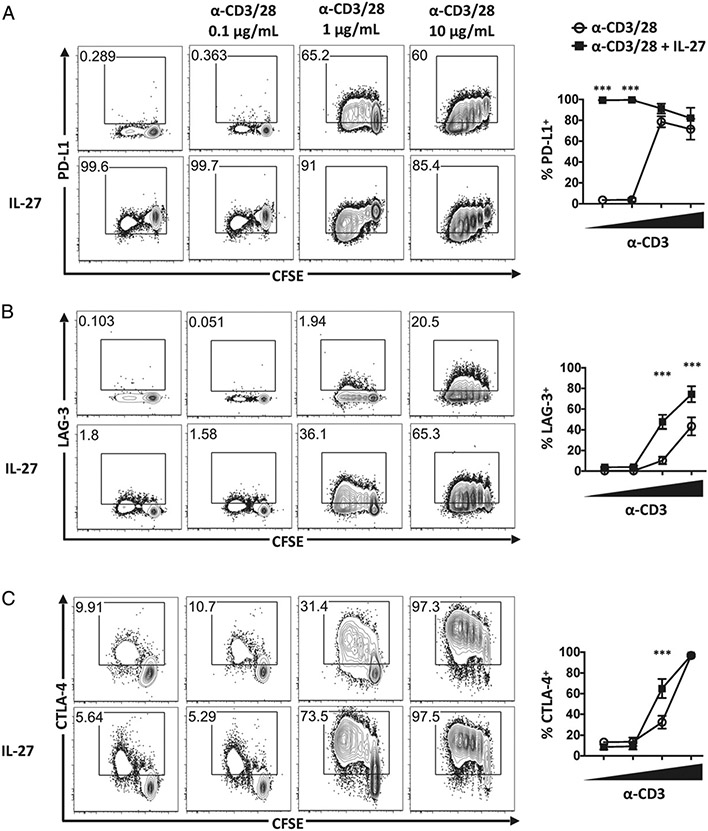
FIGURE 4. Role of IL-27 in expression of PD-L1, LAG-3, and CTLA-4 depends on strength of α-CD3/28 signaling.
Naive Ly6C− Sca-1− CD8+ T cells were sorted and cultured in the absence of α-CD3/CD28 or stimulated with 0, 0.1, 1, or 10 μg/ml plate-bound α-CD3 and 1 μg/ml soluble α-CD28 for 84 h. Cells were assessed for expression of PD-L1 (A), LAG-3 (B), and CTLA-4 (C). Representative flow plots (left). Graphs display the results of three to five independent experiments (right). Error bars indicate SEM. Statistical significance of differences between IL-27–treated and non–IL-27–treated cells was determined using a paired Student t test. *p < 0.05, **p < 0.01, ***p < 0.001.

