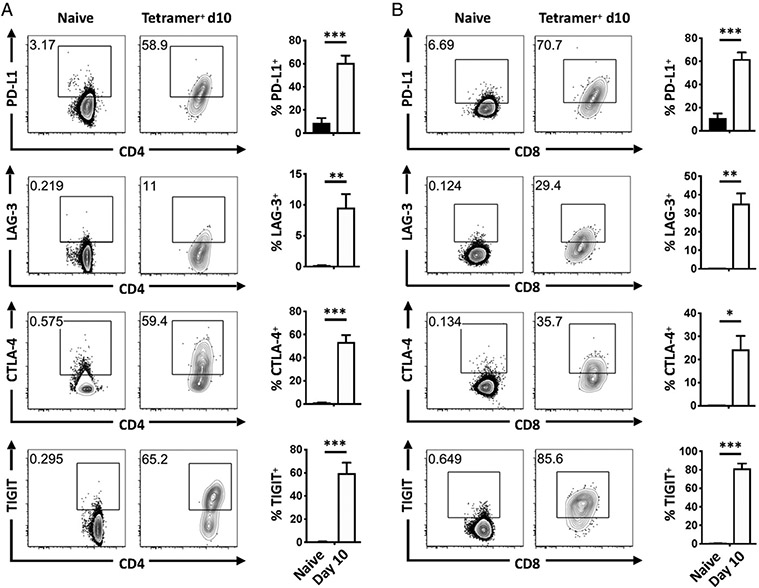
FIGURE 6. IR expression is upregulated during toxoplasmosis.
(A and B) IR expression by splenic CD4+ (A) and CD8+ (B) T cells in naive mice (gated LFA-1lo) or at day 10 of infection (gated LFA-1hi tetramer+). Representative flow plots (left) and bar charts (right) showing pooled data from four to six independent experiments, one mouse per experiment. Error bars indicate SEM. *p < 0.05, **p < 0.01, ***p < 0.001.

