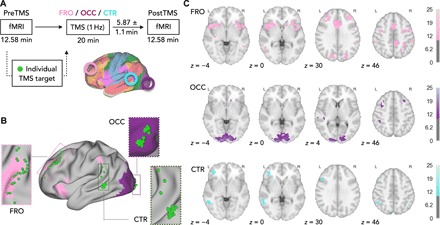
Fig. 1. Study design.

(A) Each participant underwent three counterbalanced TMS-fMRI sessions on three different days. During each session, one target region (FRO, OCC, CTR; colored circles) was stimulated for 20 min with rTMS (1 Hz), and we acquired resting-state fMRI data during preTMS and postTMS. Colored overlays on the brain surface illustrate cortical template networks (31). (B) For each subject, we derived individual target spots (green spheres) within target areas from a functional network analysis of the preTMS fMRI data. (C) Brain slices with statistical parametric maps (PFWE < 0.05, corrected at cluster level, one-sample t tests) of the group average functional connectivity of each target region during preTMS calculated from the individual TMS targets. Color bars, t values.
