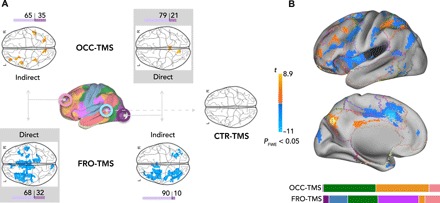
Fig. 2. Opposite effect of TMS on brain functional connectivity.

(A) Statistical parametric maps of significant changes in whole-brain functional connectivity after OCC- (top), FRO- (bottom), and CTR- (right) TMS (PFWE < 0.05, corrected at cluster level, voxel-wise repeated-measures ANOVAs). Color bar (yellow-blue), t values. OCC-TMS increased not only the functional connectivity of the OCC target (direct) but also the functional connectivity of the nonstimulated, FRO target (indirect). Conversely, FRO-TMS decreased functional connectivity to widespread cortical areas. Again, FRO-TMS had an impact not only on the functional connectivity of the stimulated, FRO target (direct) but also on the nonstimulated, OCC target (indirect). Neither of the stimulation protocols changed functional connectivity of the CTR target nor did CTR-TMS. Horizontal bar plots (violet) indicate the laterality effect of stimulation, i.e., the ratio of significant voxels in left and/or right hemispheres. (B) Summary of whole-brain functional connectivity changes as found in (A) overlaid on the cortical surface of a standard brain. Horizontal color bars indicate the ratio of significant voxels in each of the template networks as illustrated by colored outlines on the cortical surface.
