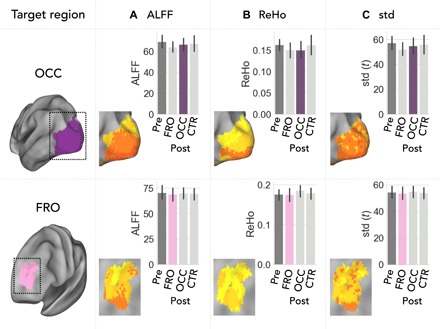
Fig. 5. No effect of TMS on local brain activity.

Bar plots indicate group average (A) amplitude of ALFF, (B) ReHo of local functional connectivity, and (C) SD of the fMRI signal averaged across all voxels of each target region. PostTMS values (colored bars) after direct stimulation did not significantly differ from any other session (PFWE > 0.05 corrected at cluster level, voxel-wise ANOVA for repeated measures). Error bars represent the 95% CI of variance across subjects.
