
Fig. 3. SNV distributions across total and functional genome in human liver.
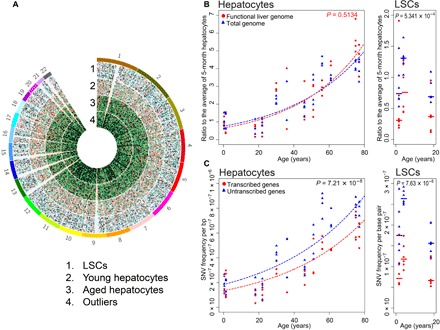
(A) Circos diagram of genomic SNV distribution in four groups: pooled LSCs, young and aged hepatocytes, and outlier cells. (B) SNV levels in the functional genome and genome overall in differentiated hepatocytes (left) and in LSCs (right) as a function of age. Each data point represents the ratio of the number of mutations per cell to the median number of mutations of the four cells from the 5-month-old subject. Mutations in the functional genome are shown in red and those in the genome overall in blue. (C) Mutation frequency per base pair in the transcribed part of the liver genome (red) and the nontranscribed part (blue) in differentiated hepatocytes (left) and LSCs (right) as a function of age.