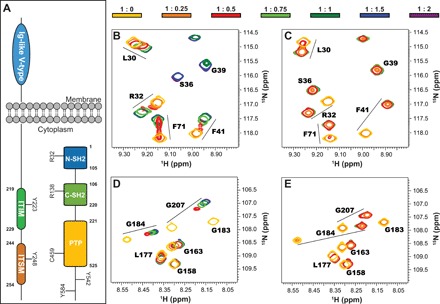
Fig. 1. Interaction of the N-SH2 and C-SH2 domains with ITIM and ITSM.

(A) Domain composition of SHP2 and PD-1. Highlighted are the conserved R32 and R138 required for binding phosphopeptides, the catalytic C459, and the putative phosphorylation sites Y542 and Y584 on SHP2, as well as the phosphorylation sites on the PD-1 cytoplasmic domain. (B and C) Excerpts from 1H-15N heteronuclear single-quantum coherence (HSQC) spectra of N-SH2 upon addition of ITIM (B) and ITSM (C). ppm, parts per million. (D and E) Excerpts from 1H-15N HSQC spectra of C-SH2 upon addition of ITIM (D) and ITSM (E). The protein concentration was 200 μM; the color code (top) indicates the protein:peptide molar ratios. All spectra were recorded at 298 K and 600 MHz.
