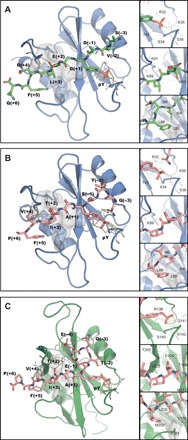
Fig. 2. Structure of SH2 domains in complex with ITIM and ITSM.

(A) Crystallographic structure of N-SH2–ITIM. N-SH2, blue; ITIM, green. (B) Crystallographic structure of N-SH2–ITSM. N-SH2, blue; ITSM, pink. (C) Lowest energy structure of the NMR ensemble of C-SH2–ITSM. C-SH2, green; ITSM, pink. In each panel, an overview of the complete structure is shown on the left (with protein hydrophobic patches interacting with the peptide C-terminal region shown as gray surfaces). Insets on the right show the interactions of the phosphate group (top), H bonds formed between the peptide and the BG loop of the protein (middle), and hydrophobic interactions of the peptide C-terminal region (bottom). The peptide residues are numbered starting from the pY residue (zero) as positive and negative numbers in the direction of the C and N terminus, respectively.
