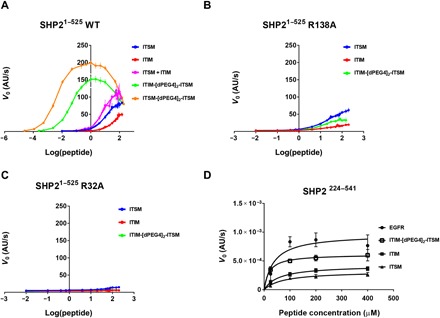
Fig. 3. SHP2 activation in vitro by different PD-1–derived phosphopeptides.

(A) DiFMUP-based activation assays of WT SHP2 with increasing concentrations of ITIM, ITSM, ITIM-[dPEG4]2-ITSM, and ITSM-[dPEG4]2-ITSM peptides. (B and C) DiFMUP-based activation assay of the SHP2-R32A (B) or the SHP2-R138A mutant (C) with increasing concentrations of ITIM, ITSM, and ITIM-[dPEG4]2-ITSM. In (A) to (C), the individual data points represent mean values with the error bars corresponding to the SEM of three independent experiments, each performed in triplicate. (D) EnzChek-based phosphatase activity assay of SHP2224–541 with peptides at concentrations of 25, 100, 200, and 400 μM. The slope values from the linear range of the kinetic curves are plotted as initial velocities. The individual data points represent mean values with error bars corresponding to the SEMs of three independent experiments (each performed in duplicate) for all cases except for ITIM-[dPEG4]2-ITSM, where only two independent experiments were performed. AU, arbitrary units; V0, initial velocity.
