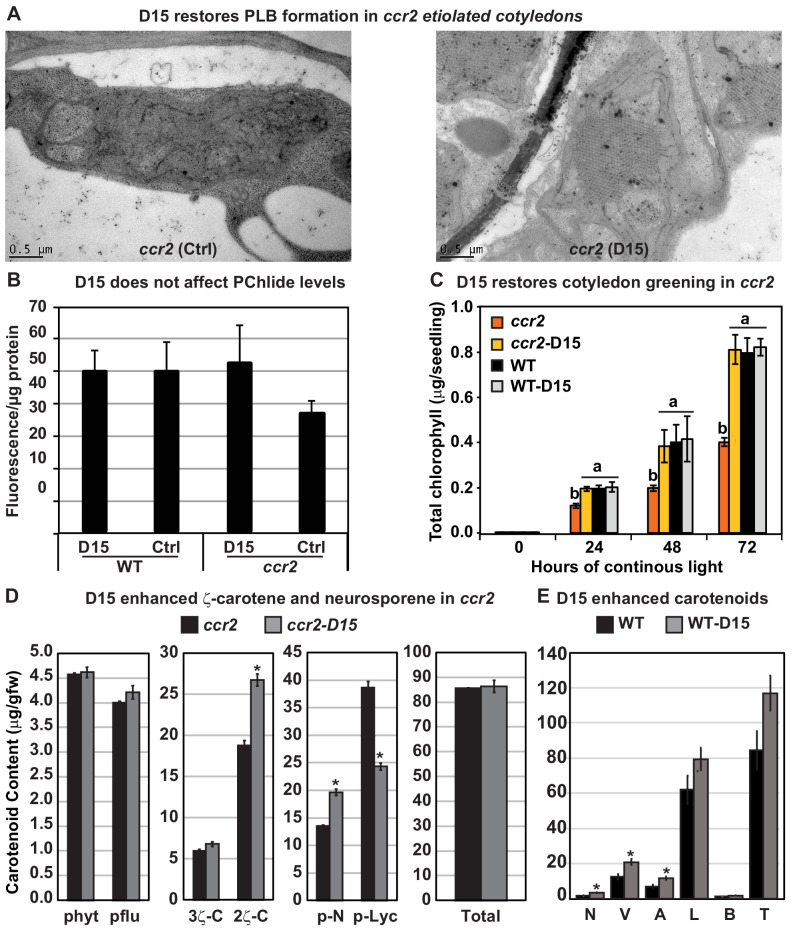
Figure 6. The carotenoid cleavage dioxygenase (CCD) inhibitor, D15, restores PLB formation in etiolated ccr2 seedlings, cotyledon greening following de-etiolation and alters cis-carotene accumulation.
(A) Transmission electron micrographs of a representative etioplast from 5-d-old dark grown cotyledons reveal a well-developed PLB in ccr2 treated with the D15, but not in ccr2 treated with ethanol only (control; ctrl). (B) Pchlide levels in Wild Type (WT) and ccr2 treated + /- D15. Fluorescence was measured at 638 nm and 675 nm with an excitation at 440 nm. Net fluorescence of Pchlide was calculated and normalised to protein content. (C) D15 restores chlorophyll accumulation in ccr2 de-etiolated seedlings exposed to continuous light. Twenty seedlings from each of three biological replicates were harvested for chlorophyll determination in every 24 hr under continuous light. Statistical analysis was by ANOVA with a post-hoc Tukey test (n = 20 seedlings). (D) cis-carotene quantification in etiolated cotyledons of ccr2 treated with D15. phytoene (phyt), phytofluene (pflu), tri-cis-ζ-carotene (3ζ-C), di-cis-ζ-carotene (2ζ-C), pro-neurosporene (p-N), tetra-cis-lycopene (p-lyc) and total cis-carotenes were quantified at absorption wavelengths providing maximum detection. Star denotes significance (ANOVA, p<0.05). Error bars show standard error (n = 4). (E) Quantification of carotenoid levels in etiolated tissues of WT treated with D15. Neoxanthin (N); violaxanthin (V); antheraxanthin (A), lutein (L), β-carotene (β-C) and total carotenoids (T) were quantified at a 440 nm absorption wavelength providing maximum detection. Star denotes significance (ANOVA, p<0.05). Data is representative of two independent experiments.


