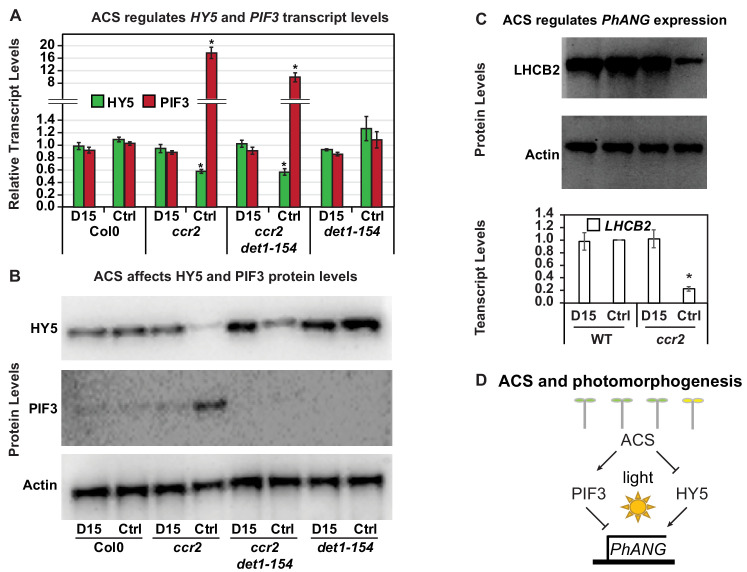
Figure 8. Chemical inhibition of CCD activity revealed how a ccr2 generated apocarotenoid signal transcriptionally represses HY5 and LHCB2 expression during photomorphogenesis.
(A) Transcript levels of PIF3 and HY5 in WT, ccr2, ccr2 det1-154 and det1-154 de-etiolated seedlings growing on MS media + /- D15. (B) Representative western blot images showing PIF3 and HY5 protein levels in WT, ccr2, ccr2 det1-154 and det1-154 de-etiolated seedlings growing on MS media + /- D15. The membrane was re-probed using anti-Actin antibody as an internal loading control. (C) Protein and transcript levels of LHCB2 expression in WT and ccr2 de-etiolated seedlings growing on MS media + /- D15. (D) Model showing how ACS regulates HY5 and LHCB2 expression in ccr2. Images of seedlings represent are cotyledons are coloured green or yellow to reflect the delay in chlorophyll biosynthesis induced by ACS as evidenced in Figure 6c. De-etiolation of seedlings was performed by transferring 4-d-old etiolated seedlings to continuous light for 3 d to induce photomorphogenesis. Statistical analysis denoted as a star was performed by pair-wise t-test (p<0.05). Error bars represent standard error of means. Ctrl; Control; Ctrl, D15; chemical inhibitor of CCD activity.

